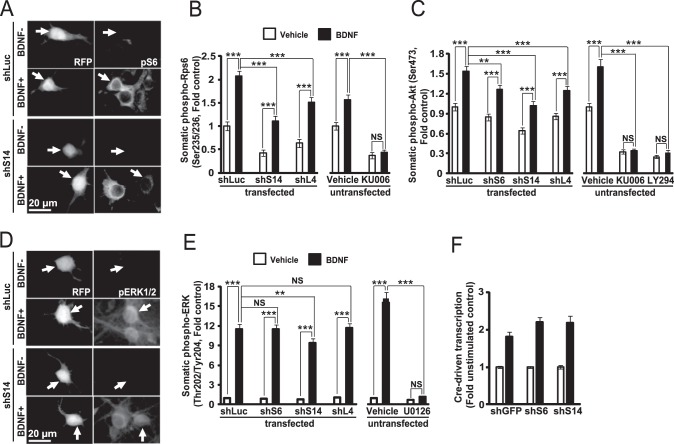
FIGURE 6.
Inhibition of ribosomal biogenesis does not prevent signaling responses to BDNF. A–E, neurons were transfected as for studies in Fig. 5, D and E. After 2 days, cells were stimulated with 50 ng/ml BDNF for 60 min (A–C) or 10 min (D and E) as indicated. A and B, S6 phosphorylation at residues Ser-235/236 (pS6) was monitored by immunofluorescence to determine activation of the PI3K-TORC1 pathway. A, representative images of transfected cells (arrows). B, analysis of perikaryal FI of the pS6 signal in transfected neurons revealed that RP knockdown did not prevent BDNF-mediated activation of TORC1. Conversely, the activation was abolished by the drug inhibitor of mTOR, KU0063794 (0.3 μm, KU006). However, BDNF effects on pS6 were reduced by shRPs. C, similar effects were also observed when TORC2 activity was monitored by immunofluorescence for the phosphorylated form of Akt at Ser-473. D and E, immunostaining for the phosphorylated ERK1/2 residues Thr-202/Tyr-204 (pERK1/2) revealed that RP knockdowns did not prevent the BDNF-mediated activation of the ERK1/2 pathway except its moderate reduction with shS14. The BDNF effect was abolished by the drug inhibitor of the ERK1/2 pathway, U0126 (50 μm). F, DIV4 neurons were transfected as for Fig. 5, A and B, except the CRE-luciferase reporter plasmid was added (0.4 μg of plasmid DNAs/2·105 neurons) and shRNA against GFP (shGFP) was used as a control. On DIV6, 10 ng/ml BDNF was added for 8 h as indicated. CRE-driven transcription was determined by measuring luciferase activity that was normalized against β-gal activity. BDNF-mediated activation of CRE-driven transcription was unaffected by inhibition of ribosomal biogenesis. B, C, and E, data represent means ± S.E. of fold controls as defined by dividing the FI value of a cell by the average FI value of control cells (shLuc-transfected, no BDNF stimulation); at least 60 (B and C) or 48 (E) randomly selected individual neurons from three independent experiments were analyzed; **, p < 0.01; ***, p < 0.001; NS (not significant), p > 0.05. F, fold controls were calculated as ratios of β-gal-normalized luciferase activity from each sister culture to the average of control cultures (shGFP-transfected, no BDNF stimulation); means ± S.D. of eight sister cultures from two independent experiments are depicted.

