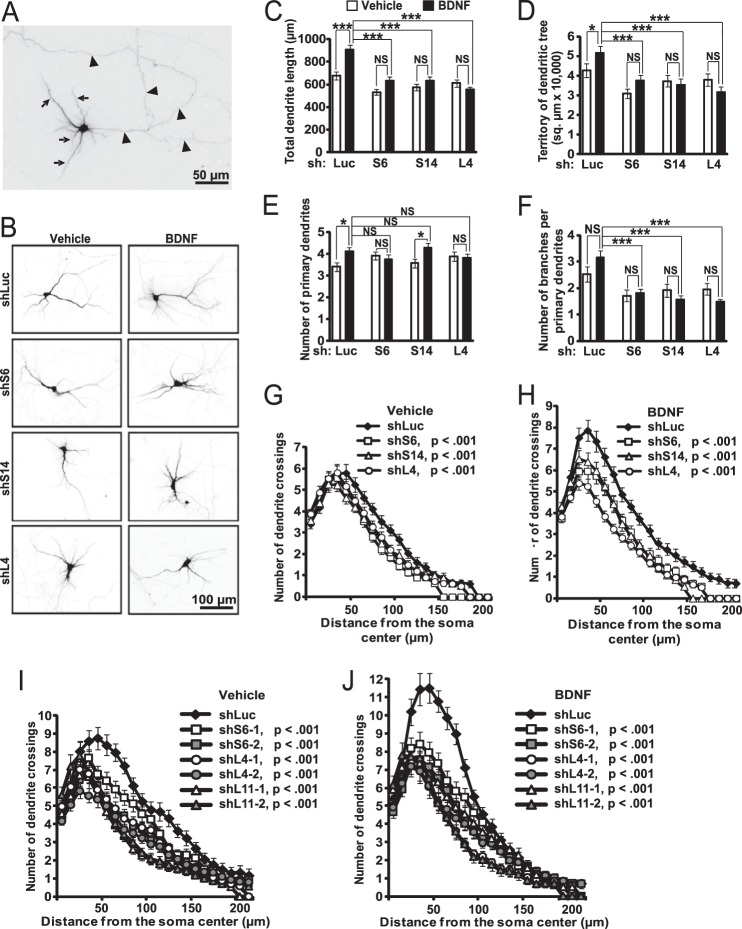
FIGURE 8.
Disruption of BDNF-stimulated dendritic outgrowth by inhibition of ribosomal biogenesis. DIV6 hippocampal neurons were co-transfected with expression plasmids for EGFP and shRNAs against RPs or a control shRNA (shLuc, 0.075 + 0.4 μg of plasmid DNAs/2·105 neurons, respectively). On DIV8, half of the cultures were treated with 50 ng/ml BDNF for 24 h. Transfected neurons were visualized by GFP immunostaining. A and B, representative images of transfected neurons. A, for morphometric analysis only neurites with dendritic characteristics were selected (e.g. decreasing diameter, typically more than one dendrite present per cell, arrows). Conversely, axon-like neurites were excluded (uniform diameter, a single axon present per cell, arrowheads). C–H, BDNF-stimulated dendritic growth was abolished or reduced by RP knockdowns, including total dendritic length (C, two-way ANOVA, effects of BDNF or shRNA or their interaction, F1,399 = 13.285 or 19.288 or 6.466, respectively; p < 0.001), dendritic territory (D, two-way ANOVA, effects of BDNF or shRNA or their interaction, F1,399 = 0.783/p > 0.05 or 8.267/p < 0.001 or 2.804/p < 0.05, respectively), and number of primary dendrites (E, two-way ANOVA, effects of BDNF or shRNA or their interaction, F1,399 = 4.305/p < 0.05 or 0.235/p > 0.05 or 2.811/p < 0.05, respectively), as well as overall complexity of the dendritic tree as revealed by Sholl analysis (G and H). Although branching was not significantly enhanced by BDNF, it was consistently reduced by shRPs (F, two-way ANOVA, effects of BDNF or shRNA, F1,399 = 0.033/p > 0.05/or 12.8/p < 0.05, respectively). I and J, reduced dendritic complexity after knocking down RPs using individual shRNAs. Data are means ± S.E. of at least 44 (C–H) or 30 (I and J) randomly selected individual neurons/condition from three (C–H) or two (I and J) independent experiments; *, p < 0.05; ***, p < 0.001; NS (not significant), p > 0.05 (post hoc tests); in G–J, p values for the shRP effects on number of crossings are indicated (repeated measure one-way ANOVA, shLuc versus shRP).

