FIGURE 5.
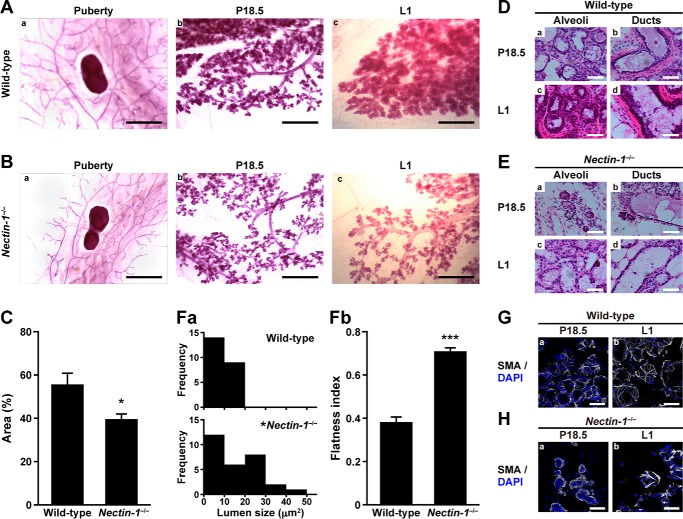
Morphological impairments in pregnancy-induced alveolar development in the nectin-1−/− mammary gland. A and B, carmine alum staining. A, panels a–c, the wild-type mammary gland; B, panels a–c, the nectin-1−/− mammary gland. A, panel a, and B, panel a, puberty; A, panel b, and B, panel b, P18.5; A, panel c, and B, panel c, L1. Scale bars, A, panel a, and B, panel a, 5 mm; A, panels b and c, and B, panels b and c, 1 mm. C and D, H&E staining. C, percentage of carmine alum-stained area at the distal site from the lymph node. For the quantification, three independent animals of wild type and nectin-1−/− at P18.5 were examined. *, p = 0.037 versus wild type as determined by Student's t test. Error bars, S.E. D, panels a–d, the wild-type mammary gland; E, panels a–d, the nectin-1−/− mammary gland. D, panel a, and E, panel a, alveoli of P18.5 mice; D, panel c, and E, panel c, alveoli of L1 mice; D, panel b, and E, panel b, ducts of P18.5 mice; D, panel d, and E, panel d, ducts of L1 mice. Scale bars, 50 μm. F, quantification of the mammary gland morphologies. F, panel a, lumen size distribution. The lumen size of 23 alveoli from three independent animals of wild type and 29 alveoli from three independent animals of nectin-1−/− at P18.5 were examined. *, p = 0.024 versus wild type as determined by χ2 test. F, panel b, cell flatness. The flatness index was obtained by dividing cell width by cell height. At least 10 cells per mouse from three independent animals of wild type and nectin-1−/− at P18.5 were examined. ***, p = 3.3 × 10⁻⁴ versus wild type as determined by Student's t test. G and H, basal cell morphologies. G, panels a and b, the wild-type mammary gland; H, panels a and b, the nectin-1−/− mammary gland. The specimens were stained with the FITC-conjugated anti-smooth muscle actin (SMA) Ab (shown in gray). Nuclei were counterstained with DAPI. G, panel a, and H, panel a, P18.5; and G, panel b, and H, panel b, L1. Scale bars, 50 μm. Results are representative of three independent experiments.

