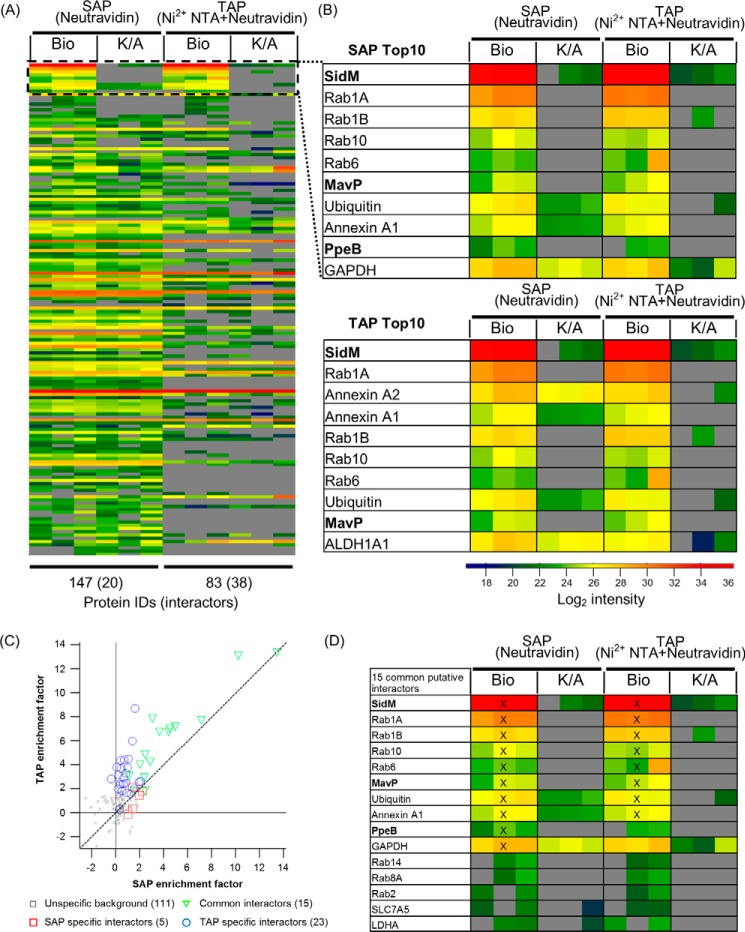
FIGURE 2.
The SidM interactome during infection. A549-BirA cells were infected with Legionella expressing His6-Bio-SidM or His6-Bio K/A-SidM. A single Neutravidin purification (SAP) was compared with a tandem affinity (Ni2+ NTA and Neutravidin) purification (TAP). Each sample was crosslinked with 1% formaldehyde, lysed in Triton X-100, and subjected to LC/MS-MS analysis. A, heat map showing intensities of all identified proteins across SAP and TAP. Proteins were ranked by enrichment factors (Bio over K/A). Missing values (gray) were imputed as an estimate of detection limit for ranking purposes. Each column represents an individual technical replicate. B, zoom of Top 10-enriched proteins identified in SidM complexes for SAP and TAP. Legionella proteins are in bold. C, plot of average protein enrichment factors of SAP replicates against TAP samples. Common interactors are shown as green triangles. SAP-specific and TAP-specific interactors are in red squares and blue circles, respectively. D, heat map showing the 15 common interactors. Top 10-enriched proteins are marked with a cross (X).

