FIGURE 4.
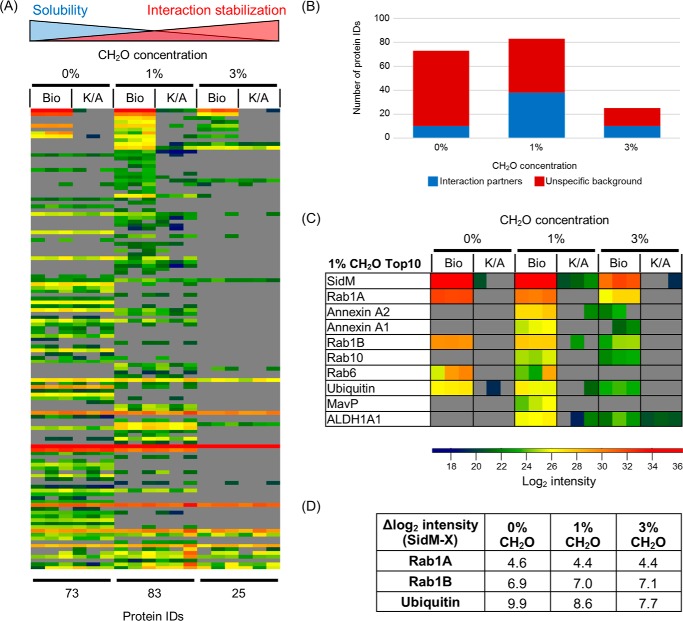
The effect of formaldehyde crosslinking concentration on SidM interactomes. A, heat map of all identified proteins across the three concentrations ranked based on enrichment factors from the 1% formaldehyde experimental condition. B, breakdown of the identified proteins into interactors and unspecific background. C, zoom of Top 10-enriched proteins identified in SidM complexes isolated from 1% formaldehyde crosslinking. D, table showing the difference in average log2 intensity between SidM and three proteins (Rab1A, Rab1B, and ubiquitin) found across all three experimental conditions.

