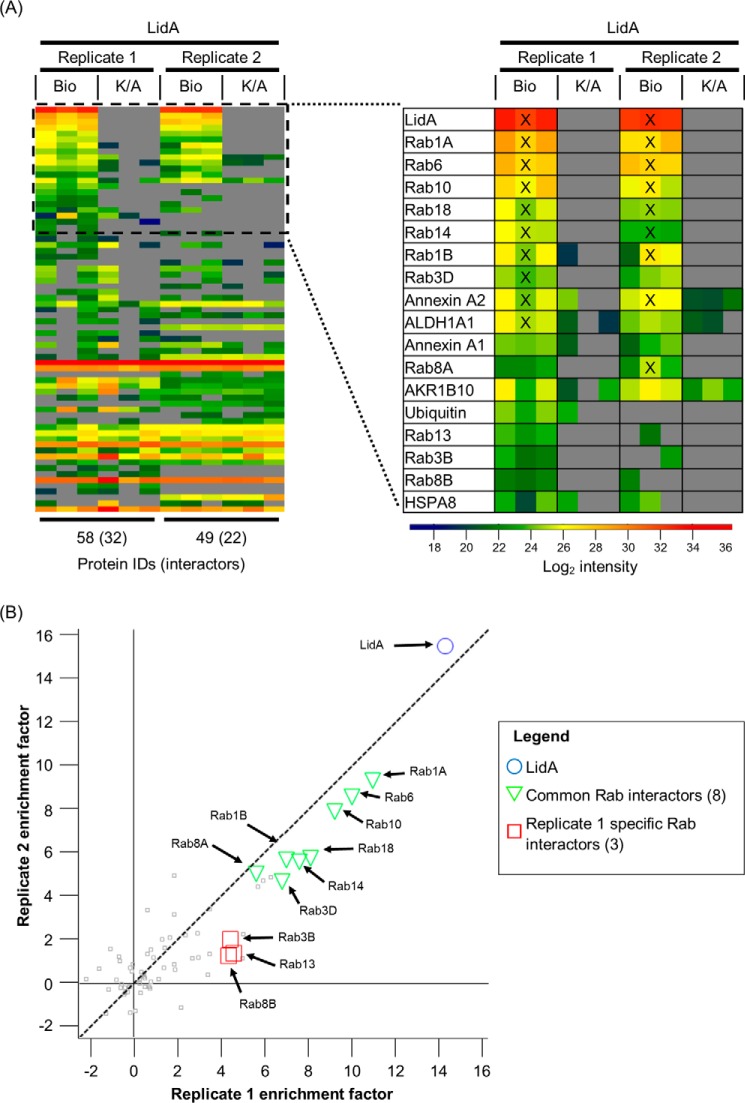
FIGURE 7.
The LidA interactome during infection. Two biological experiments (replicate 1 and 2) were performed in technical triplicate. A, heat map of all identified proteins ranked based on the enrichment factor (Bio over K/A) of replicate 1. Top 10 ranked hits are indicated with a cross (X) B, plot of average protein enrichment factors between two biological LidA experiments. LidA is highlighted as a blue circle. Rab GTPases identified as interactors found in both experiments are shown as green triangles. Interacting Rab GTPases identified in only replicate 1 are depicted by red squares.

