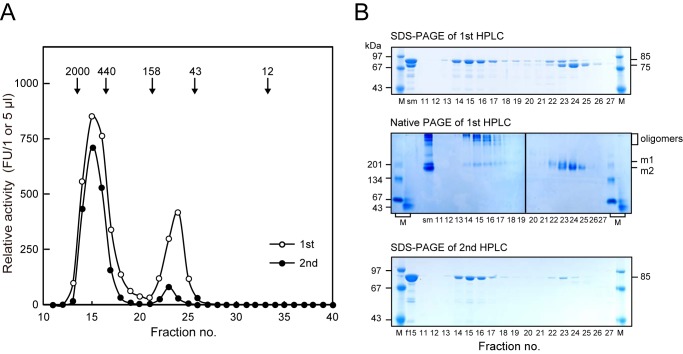
FIGURE 6.
Molecular status of recombinant AOP. A, AOP (10 mg/0.3 ml) and fraction 15 of the first HPLC (0.3 ml) were subjected to size exclusion HPLC (first and second, respectively) with a Superdex200 10/300 column, as described under “Experimental Procedures.” Relative activities (first, FU/μl and, second, FU/5 μl) were determined with Z-VKM-MCA. Molecular markers run in parallel were as follows: blue dextran 2000 (2000 kDa), ferritin (440 kDa), aldolase (158 kDa), ovalbumin (43 kDa), and cytochrome c (12 kDa). B, aliquots (2.5 μl for SDS-PAGE and 10 μl for native PAGE) of each fraction of the first HPLC were separated on polyacrylamide gels under denaturing (SDS-PAGE) and non-denaturing (native PAGE) conditions. sm, starting material (2 μg with SDS-PAGE, 16 μg with native PAGE). Positions of oligomers and monomers (m1 and m2) are indicated. Fraction 15 of the first HPLC (f15) and each fraction (5 μl) of the second HPLC were separated on SDS-polyacrylamide gels. Lanes M, molecular weight markers.

