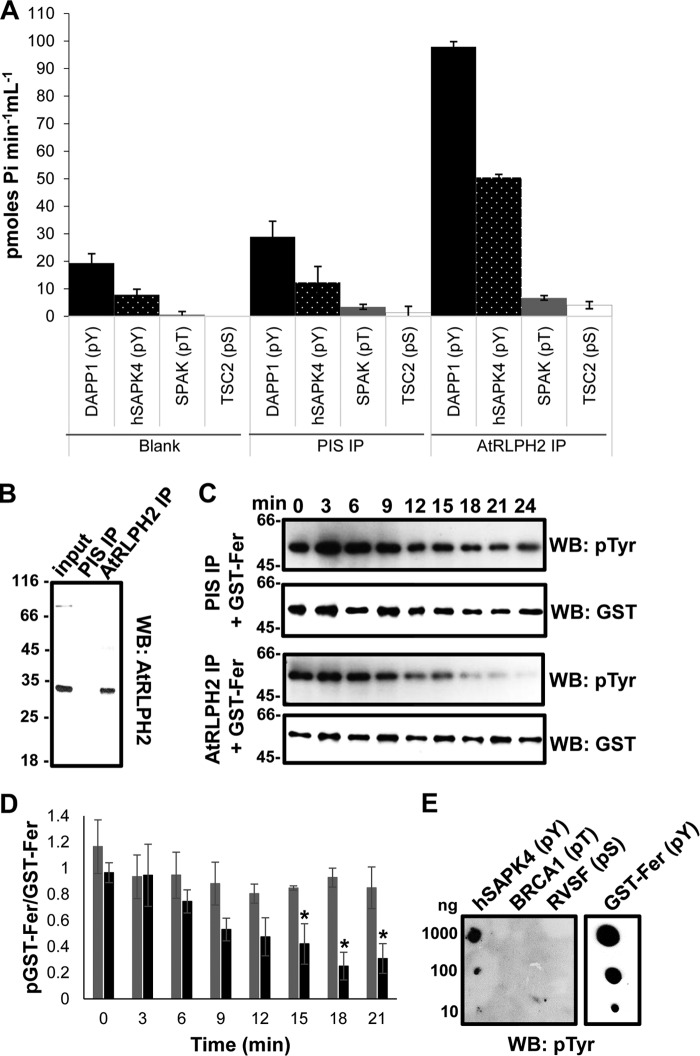
FIGURE 6.
Endogenous AtRLPH2 preferentially targets pTyr residues. A, affinity-purified anti-AtRLPH2 IgG, in parallel with PIS IgG and a peptide-only control (blank), was used to assay endogenous AtRLPH2 from a dark cell culture extract. Bead-bound AtRLPH2 was used to dephosphorylate two pTyr (pY) peptides (DAPP1, black bars; hSAPK4, white dotted black bars), a pThr (pT) peptide (SPAK3, gray bars), and a pSer (pS) peptide (TSC2, white bars) (see “Experimental Procedures” and Table 1 for peptide sequences). Error bars represent S.E. (n = 3). B, the clarified lysate (input) as well as PIS and anti-AtRLPH2 IP eluates were immunoblotted (WB) for AtRLPH2. Mass markers are shown in kDa. C, both the endogenous immunoprecipitated AtRLPH2 and the PIS control were used to dephosphorylate the autophosphorylated tyrosine kinase Fer. Aliquots of the assay were removed at the time points shown for SDS-PAGE and anti-phospho-tyrosine Western blotting (WB) analysis. Subsequently, blots were striped and probed with anti-GST IgG to visualize the quantity of GST-tagged Fer protein kinase on the membrane. A representative blot from three separate experiments is shown. In D, the Western blotting signal intensity for each time point shown in C was determined as outlined under “Experimental Procedures” and plotted as the ratio of phospho-GST-Fer to total GST-Fer. PIS IP is shown as black bars, and AtRLPH2 IP is shown as gray bars. Error bars depict ± S.E. (n = 3), and the asterisks depict a significance p ≤ 0.05 (two-tailed student's t test). E, phosphorylated peptides hSAPK4 (pTyr), BRCA1 (pThr), and RVSF (pSer) (defined under “Experimental Procedures”) or autophosphorylated GST-Fer were spotted to a membrane and probed with the anti-phospho-tyrosine IgG. In all panels, the antibody used for Western blotting (WB) is indicated.

