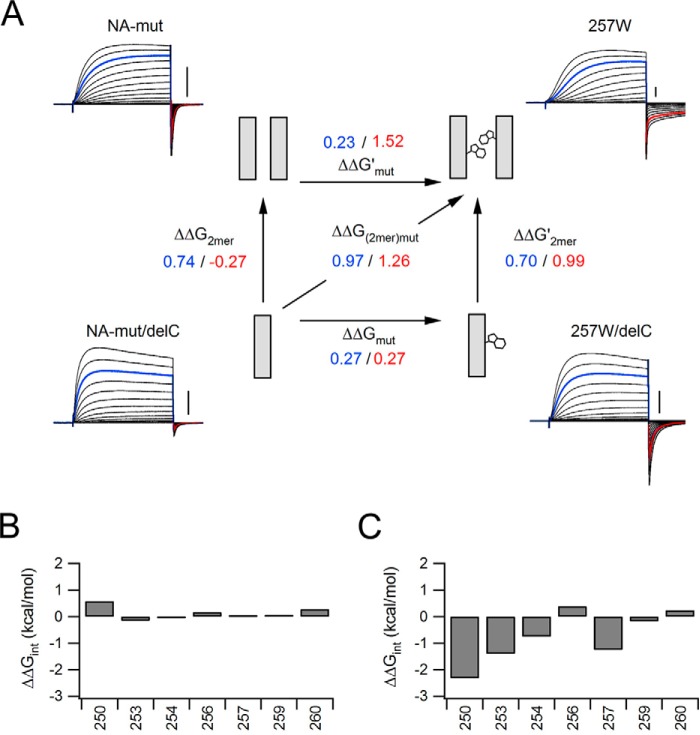
FIGURE 6.
Schematic discussion of the Hv gating. A, Schematic illustration of the Trp257 introduction. The scheme shows the coupling energy between the monomer and dimer. The numbers indicate the ΔΔG (blue, activation; red, deactivation). B and C, interaction energy profiles for channel mutation. The criterion for two well correlated residues is a value greater than 0.89. Interaction energies for positions 250, 253, and 257 show strong interaction of the two Trp residues during the deactivation phase.

