FIGURE 9.
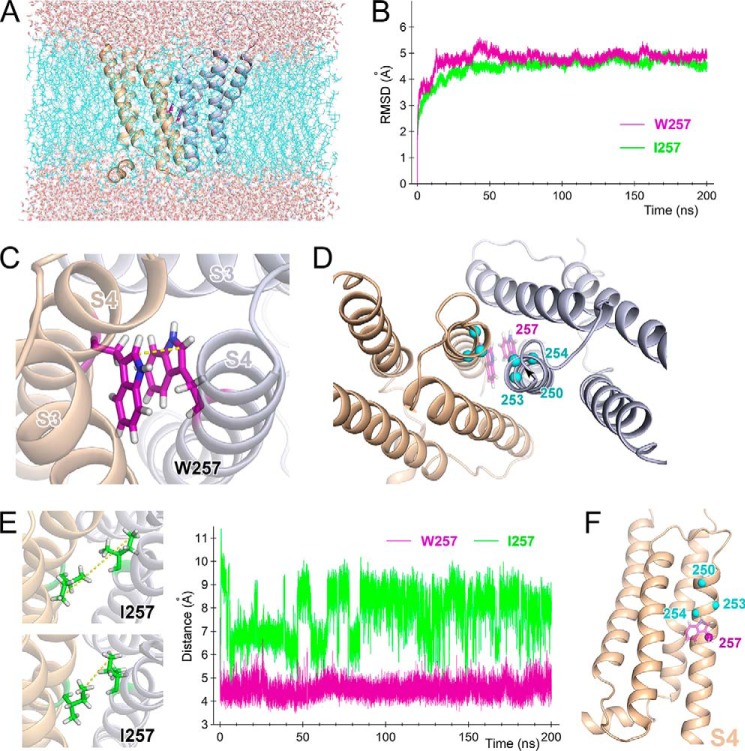
Molecular dynamics simulation for the dimeric channel. A, snapshot of the transmembrane domain from a viewpoint parallel to the membrane 197 ns into the molecular dynamics simulation. Two channel protomers are shown as ribbon models (light orange and light blue). Trp257 is shown as purple sticks between the two protomers. Cyan wires represent bulk lipid molecules, and CPK sticks outside the bilayer represent water molecules. B, time series of root mean square deviations for Cα along the entire protein for WT (purple) and the W257I (green) mutant in the molecular dynamics simulation. C, representative conformation of Trp257 within a dimer. Two channel protomers are shown as ribbon models (light orange and light blue). Trp257 is shown as purple sticks between the two protomers. D, Cα positions in the Trp residues introduced at positions 250, 253, and 254 are plotted on the resultant model structure after the molecular dynamics simulation (cyan spheres). Original Trp residues at position 257 are shown as purple sticks. E, comparison of the side chain motions of WT and W257I. Traces (on the right) depict the distances between two Cδ1s in Trp257 in the dimeric WT channel (purple) and between two Cδs in Ile257 in the dimeric W257I mutant (green). Two representative conformations of the Ile257 side chain are also shown (left). Yellow dotted lines, distance between the two Cδs (cf. Fig. 9C). F, positions 250, 253, 254, and 257 are plotted on the resultant model structure after the molecular dynamics simulation (spheres). Only one subunit is shown here.

