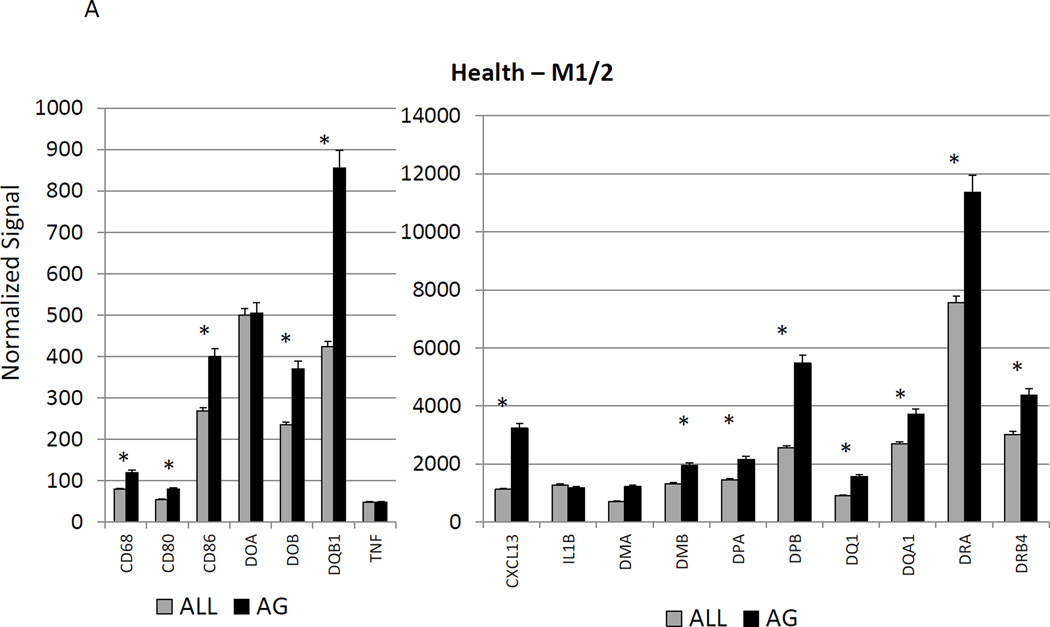
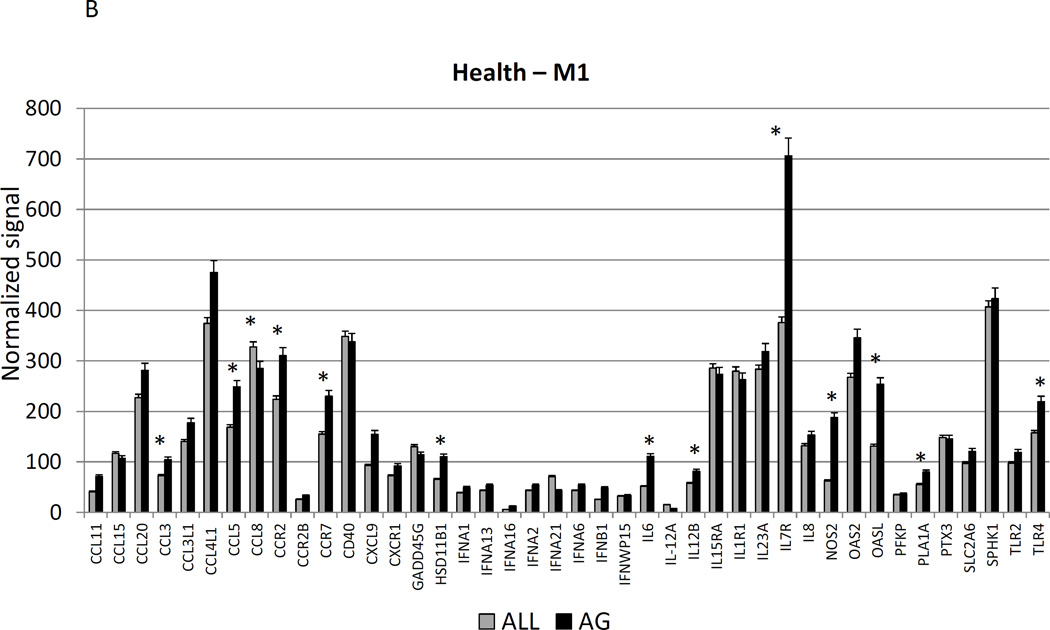
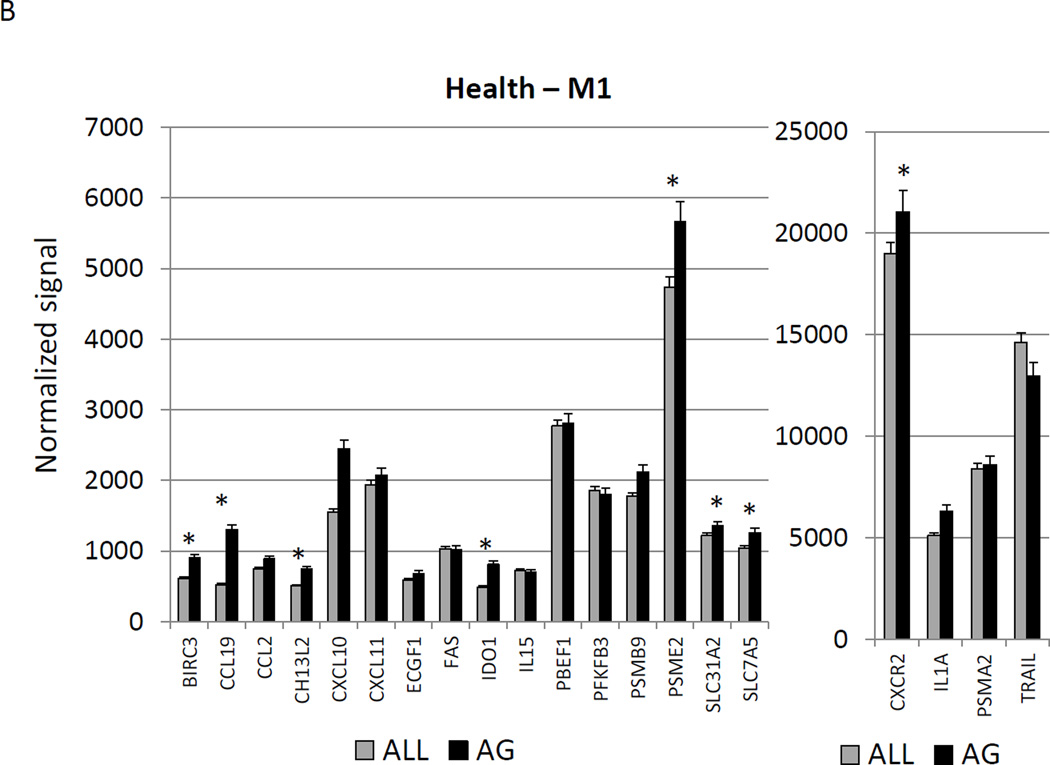
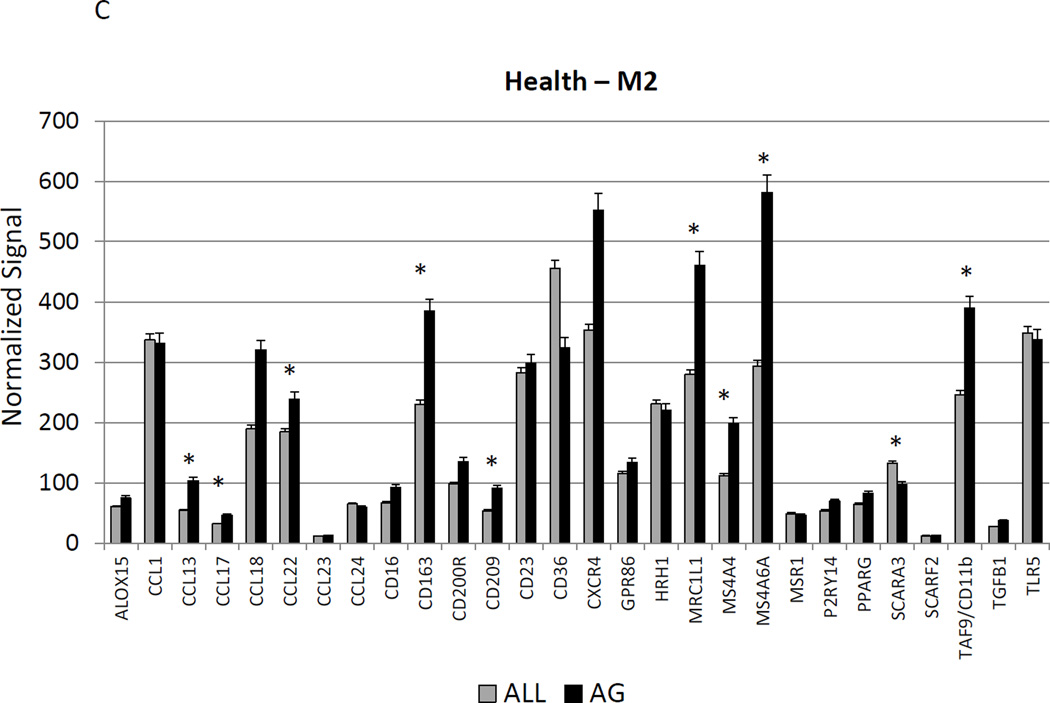
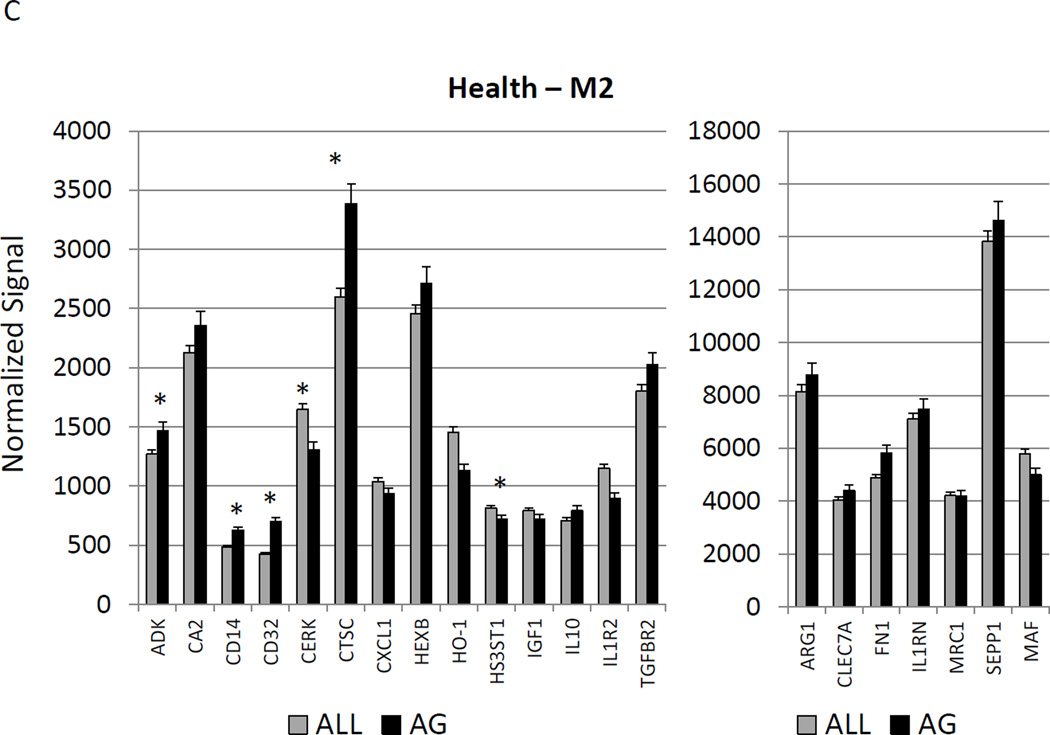
Figure 2.
Age-related changes in the gingival expression of macrophage polarization-associated genes (A) depicts expression levels of genes indicative of M1/M2 macrophages in healthy tissues. (B) shows expression levels of M1 genes and (C) of M2 genes in healthy tissues. The bars compare mean levels and the vertical brackets 1 SD, of expression in the aged animals tissues (AG) compared to gingival tissues from other age groups (ALL). Statistical analysis (*) denotes difference at least at p<0.05 using analysis of Log2 transformed data.

