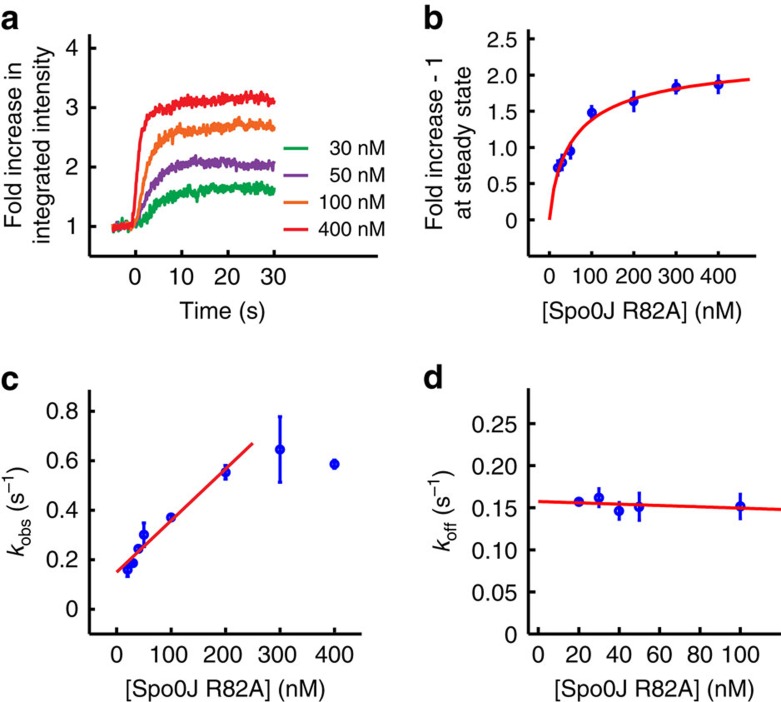
Figure 2. Measuring the binding affinity (Kd) of the Spo0J R82A mutant on individual DNA molecules.
(a) Trajectories of integrated intensity measuring association of Spo0J R82A at indicated concentrations to Cy3-labelled DNAs in binding buffer containing 150 mM NaCl. Each trajectory was averaged over 20–30 DNAs. Fold increase in integrated intensity was calculated by dividing each trajectory by the value averaged for the first few seconds before protein binding. Time zero was defined as the starting point of protein association. (b) Fold increase in integrated intensity at steady state after subtracting the baseline (onefold) fitted with a Hill equation (see Methods). (c) Observed rate constant for association (kobs) and linear fit (red line), to obtain the rate constant for association (kon). (d) Rate constant for dissociation (koff) and linear fit (red line). The average value was estimated from the y intercept, as the slope does not significantly differ from zero. All data points shown in b–d are mean±s.e.m. between at least three replicates.

