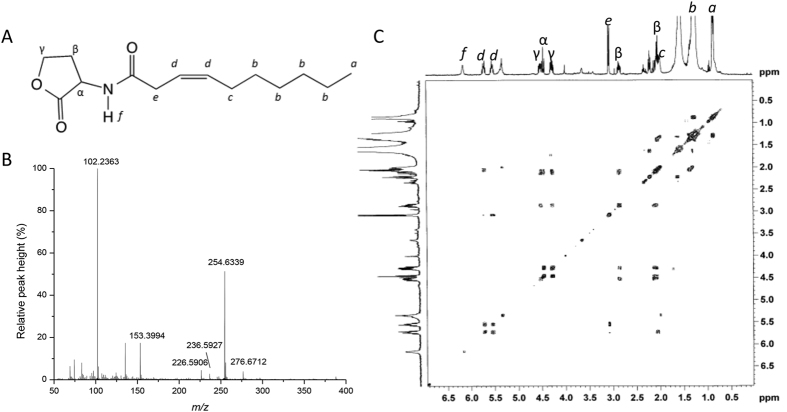
Figure 4.
Predicted structure (A), LC-MS (B), and proton NMR and COSY spectrum (C) purified from the extracts of the recombinant E. coli strain containing the nwiI gene. The protons are indicated by italicized letters and correspond to the following peaks in the 1H-NMR (CDCl3, 400 MHz) spectrum: δH 0.88 (3H, t, a,), 1.29 (8H, m, b), 2.01 (2H, m, c), 2.11 (1H, m, β), 2.86 (1H, m, β), 3.08 (2H, d, e), 4.28 (1H, m, γ), 4.47 (1H, t, α), 4.53 (1H, m, γ), 5.54 (1H, m, d), 5.73 (1H, m, d), and 6.17 (1H, m, f).

