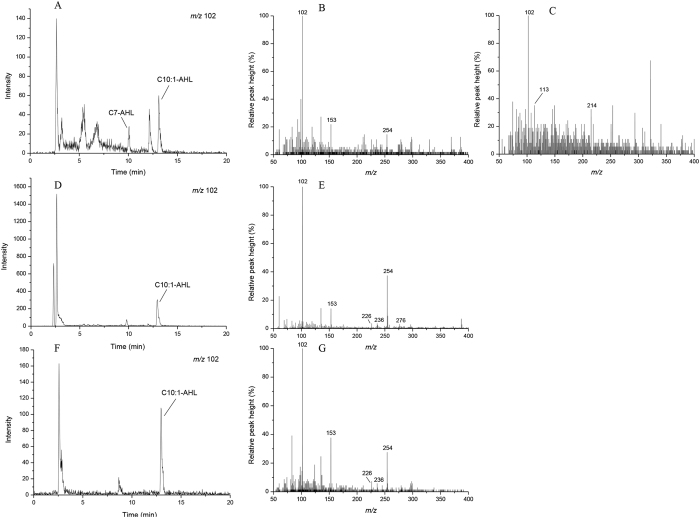
Figure 6. LC-MS chromatograms of the AHLs molecules in N. winogradskyi under different culture conditions.
(A) Chromatogram of the lactone moiety at m/z 102 from the N. winogradskyi mixotrophic culture extract. (B,C) The mass spectra of mixotrophic culture extracts reveal molecular ions [M + H] of m/z 214 and 254. (D) Chromatogram of the lactone moiety at m/z 102 from the N. winogradskyi autotrophic culture extract. (E) The mass spectra of the autotrophic culture extracts reveal molecular ions [M + H] of m/z 254. (F) Chromatogram of the lactone moiety at m/z 102 from the N. winogradskyi heterotrophic culture extract. (G) The mass spectra of the heterotrophic culture extracts reveal molecular ions [M + H] of m/z 254.

