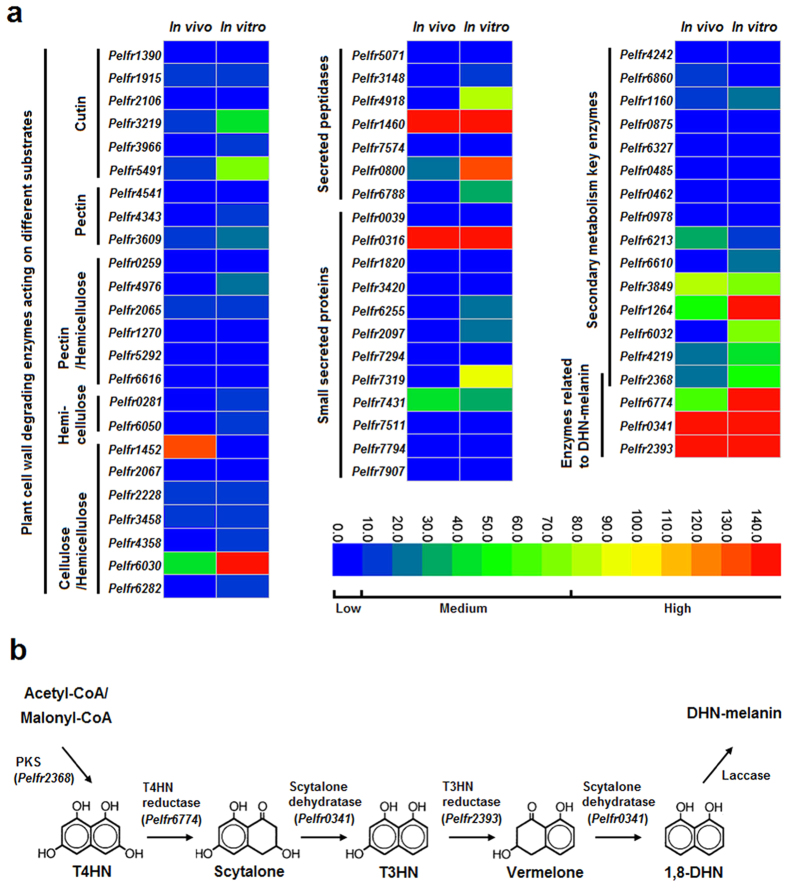
Figure 3. Functional analysis of the genes involved in adaptation of P. fructicola to its ecological niche.
(a) Expression profiling of genes encoding secreted proteins and plant cell wall degrading enzymes and genes involved in biosynthesis of secondary metabolites. For the heatmaps, two columns represent different treatments, i.e., inoculation on apple fruit (in vivo) and growth on PDA media (in vitro), and each row is marked with the name of one gene (in italics). The colored scale bar of expression levels is divided into three grades: low (0 < RPKM < 10, including 0), medium (10 < RPKM < 80), and high (80 < RPKM). (b) Schematic representation of the fungal DHN-melanin biosynthesis pathway. Enzymes catalyzing the first five steps have been detected in the P. fructicola genome with their corresponding encoding genes listed in parentheses. RPKM, reads per kilobase per million mapped reads.

