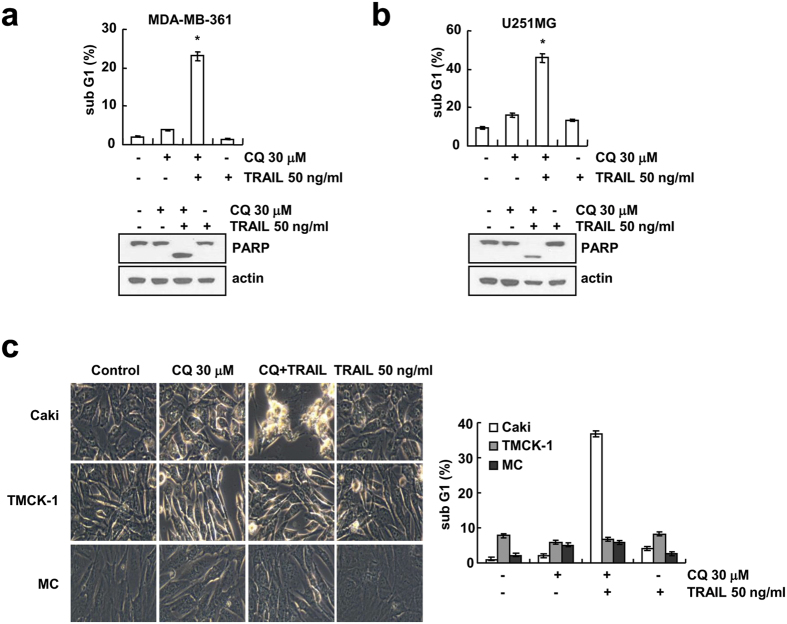
Figure 2. Effect of CQ plus TRAIL-induced apoptosis in other cancer cell lines and normal cells.
(a,b) MDA-MB-361 and U251MG cells were treated with 50 ng/ml TRAIL in the absence or the presence of 30 μM CQ for 24 h. Apoptosis was analyzed as the sub-G1 fraction by FACS analysis. The protein expression of PARP was determined by Western blotting. The level of actin was used as a loading control. (c) Caki, TMCK-1 and MC cells were treated with 50 ng/ml TRAIL in the absence or the presence of 30 μM CQ for 24 h. The cell morphologies were determined by interference light microscopy. Images were magnified X200. Apoptosis was analyzed as the sub-G1 fraction by FACS analysis. The values in panel (a–c) represent the mean ± SD from three independent samples. *p < 0.01 compared to the control.

