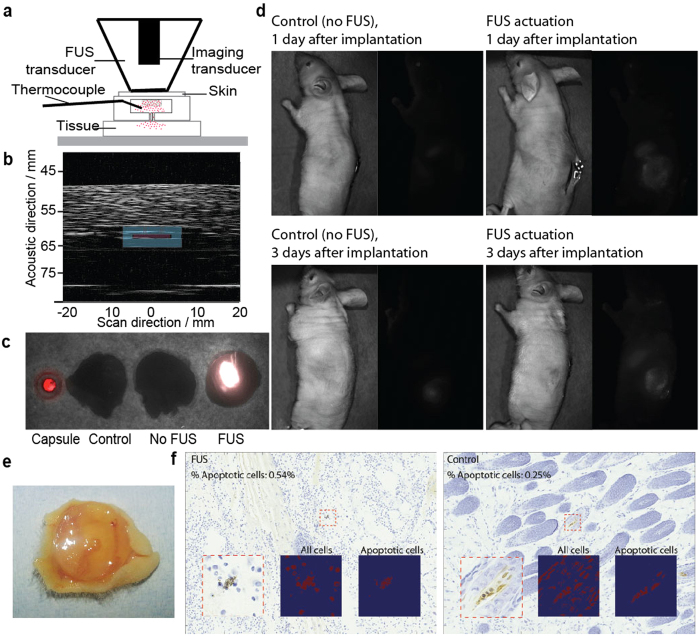
Figure 5. Compound release in ex vivo chicken and in vivo mouse.
(a) Schematic diagram of the experiment set up used for the FUS-induced ex vivo experiments. During the ex vivo experiments the imaging transducer was used to non-invasively monitor the temperature inside the gel to control the FUS using a feedback loop. (b) Ultrasound image of the device placed between two layers of 10 mm of chicken breast. The image shows a perpendicular cut of the device in the x-z plane. For clarity, a drawn overlay of the device shows its location. (c) Merged bright image and fluorescent image (λex = 670 nm, λem = 702 nm) of a gel capsule sandwiched between a lower layer of chicken tissue and a top layer of mouse skin. The four samples were capsule alone, chicken tissue alone, capsule embedded in tissue at 37 °C on a hot plate for 10 minutes, and FUS-actuated (at set-temperature of 45 °C) for 10 minutes. The ultrasound actuation took place from the top through the mouse skin and the AlexaFluor-dextran release was from the bottom part of the capsule towards the chicken tissue. (d) In vivo results for FUS induced dextran release. Representative bright field and fluorescence images of control (no FUS actuation) and FUS-administered mouse. All mice were sacrificed and NiPAAm gels explanted before imaging. FUS actuation was for all cases 10 minutes at <00 W/cm2 (estimated using radiation-force balance as demonstrated in prior studies67,68). (e) Photograph of an explanted device after 2 weeks of being implanted in a mouse. (f) TUNEL stained histology samples of the tissue immediately on top of the gel for a mouse treated with FUS and a control one (no FUS).

