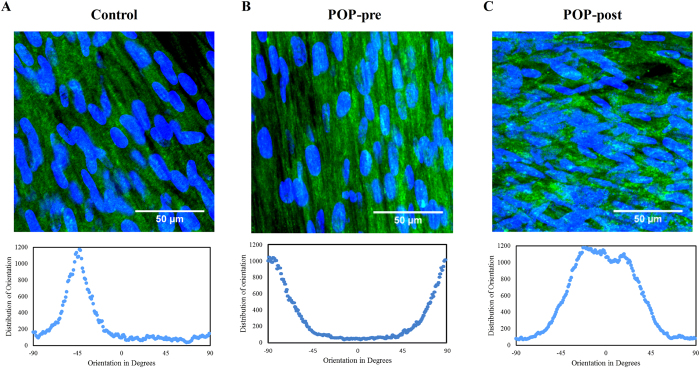
Figure 2. Collagen type I fibres and cell nuclei were aligned in one preferential direction in control and premenopausal POP groups but not in the postmenopausal POP group.
Representative immunohistochemistry micrographs of collagen I (green) and cells nuclei (blue) in deposited matrices after five weeks of culture of cells derived from (A) control, (B) prolapsed premenopausal (POP-pre), and (C) prolapsed postmenopausal (POP-post). The figure depicts the maximum intensity projection from z-stacks (top panel) and their corresponding fiber orientation (bottom panel). Images were acquired with 63 x objective of a Leica microscope. The bar is 50 μm.

