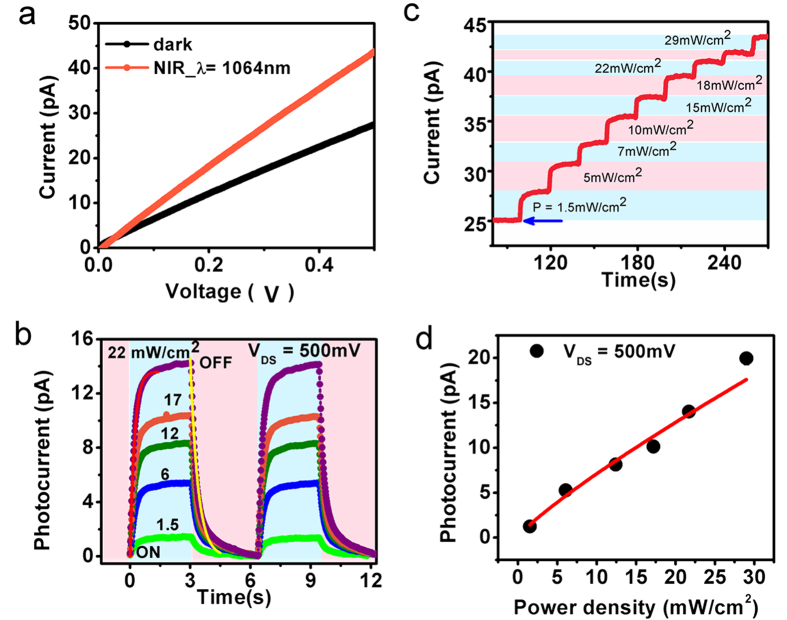
Figure 3. Experimental demonstration of NIR (1064 nm) detection in CdS films with Au nanoislands.
(a) The black curve shows dark state and the orange curve shows photoresponse of the device in presence of NIR light. (b) Photocurrent measurement showing dependency on the illuminated laser power at constant bias voltage for repetitive on/off cycles of laser light. The red and yellow curves are the rise and decay curve fits. (c) The red curve depicts the response of the device monitored as a function of bias voltage, time and power of the illumining laser light. The rapid increase and saturation plateaus in current means NIR light on states and rapid increase in current saturates at a particular power of the laser as shown by the horizontal colour bar shades. (d) The power law dependency of photocurrent shown by the red curve fit.

