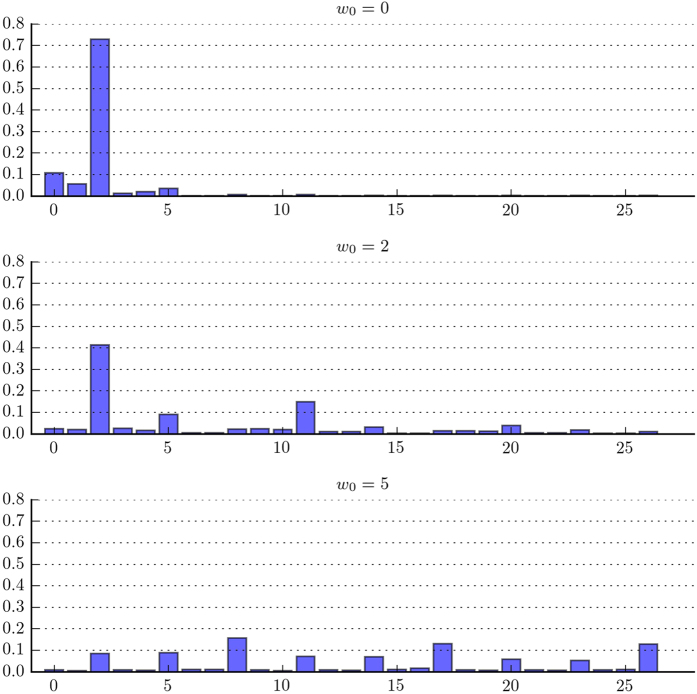
Figure 6. Average cooperation level  and the logarithm of the average length of cooperative epochs log(L) for different baseline fitness (w0).
Shaded area represents the corresponding 95% confidence intervals. As shown in the graphs, cooperation emerges for a wide range of parameter values. Increasing the probability of group conflicts, decreasing group size, or decreasing migration rate all lead to an increase in cooperation level and stability of cooperation. In all simulations where cooperation levels are high, we observe the prevalence of Type 2 strategy. Overall cooperation level increases with the value of w0: contribution increases from a bit over 60% at w0 = 0 to over 80% at w0 = 5. The stability of cooperation does not change significantly with selection strength.

