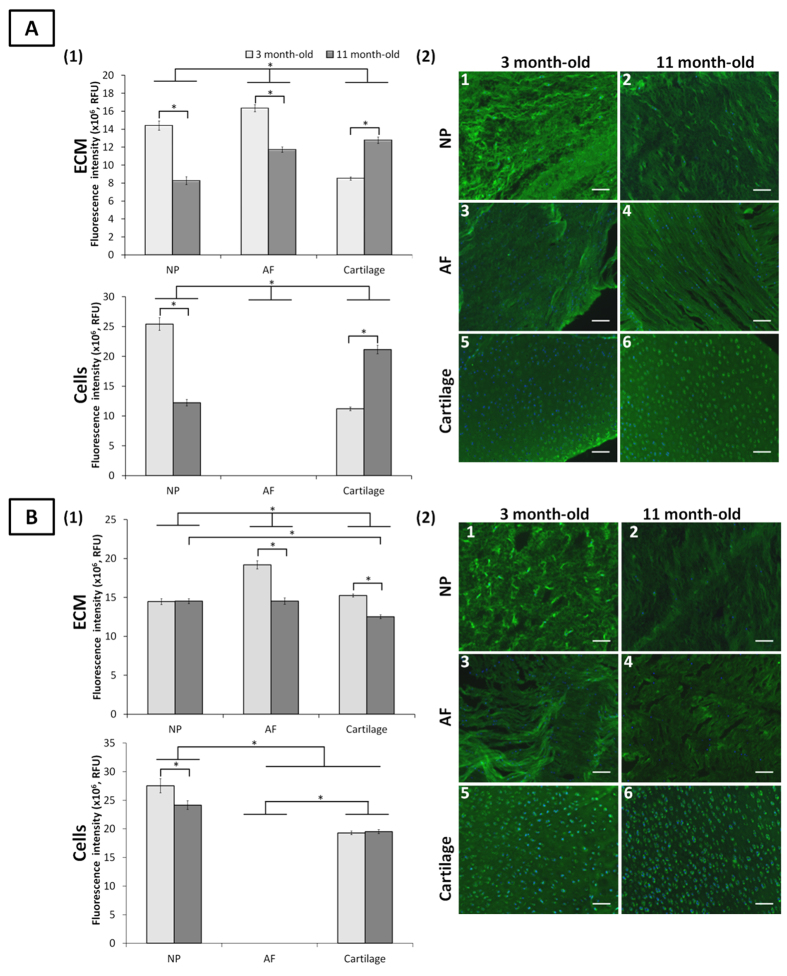
Figure 2. Sialylated motifs detected by SNA-I and MAA lectin staining in ovine NP, AF and cartilage tissues at three and 11 months.
Quantification of SNA-I (A1) and MAA (B1) lectins binding to the ECM and onto the cells of NP, AF and cartilage tissues. Data were normalised to surface area and represented as mean ± standard error of the mean (n = 5). *denotes significant differences between the different groups at p < 0.05. Representative fluorescent images of the stained sialylated motifs detected by SNA-I (A2) and MAA (B2) lectins binding in NP, AF, and cartilage tissues. Sialylated motifs and nuclei are stained in green and blue, respectively. Scale bar = 100 μm.

