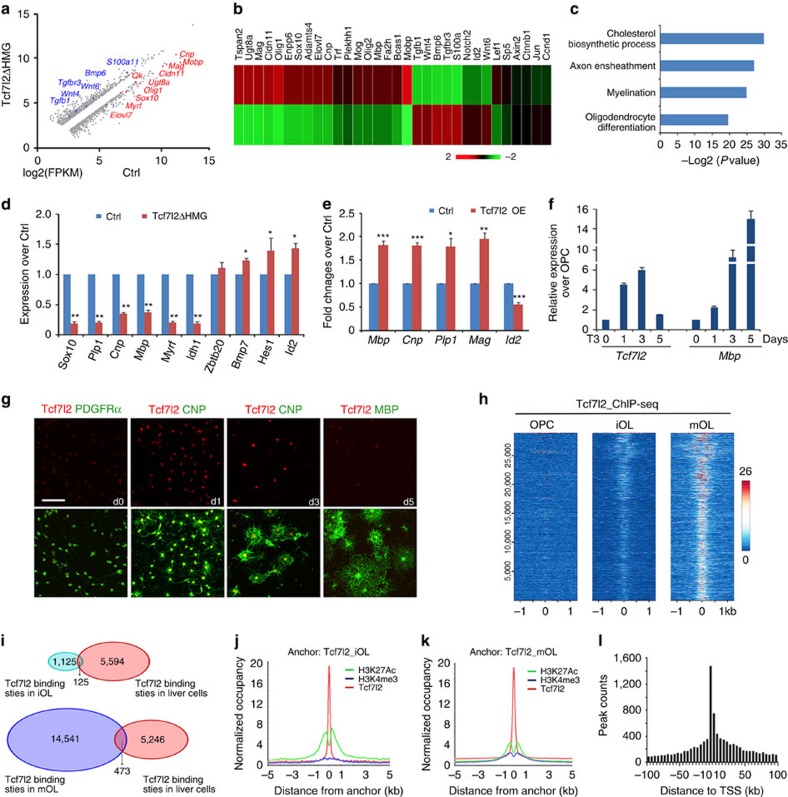
Figure 3. Transcriptome analysis of Tcf7l2-regulated genes and direct targets identified by ChIP-seq.
(a) A representative scatter plot of RNA-seq (log2 scale) from control and Tcf7l2ΔHMG optic nerves at P12 (fold change>1.5). Downregulated genes are labelled in red colour and upregulated genes in blue colour. (b) Heatmap of representative altered gene expression in RNA-seq analysis of control and Tcf7l2ΔHMG optic nerves at P12. (c) GO analysis identified biological processes that involve genes significantly downregulated in Tcf7l2ΔHMG compared with control mice at P12. (d) qRT–PCR validation of downregulation of myelination-associated genes in Tcf7l2ΔHMG optic nerves compared with controls (n=three animals per genotype). (e) qRT–PCR analysis of expression of myelination-related genes in rat OPCs after transfection with control and the Tcf7l2-overexpressing (OE) vectors for 72 h; n=3 independent experiments. (f) Real-time qRT–PCR analysis of Tcf7l2 and Mbp expression in OL lineage cells. OPCs were cultured under differentiation conditions in medium containing T3 for 0, 1, 3 and 5 days (n=3 independent treatments). (g) Immunostaining for Tcf7l2 expression in OPCs (PDGFRα+), differentiating and maturating OLs (CNP+), terminal differentiated OL (MBP+) induced by triiodothyronine (T3) treatment of OPCs for 0, 1, 3 and 5 days (d), respectively. (h) Heatmap of Tcf7l2-binding signals in OPCs (left), iOLs (OPC exposure to T3 for 1day, middle) and mOLs (OPC exposure to T3 for 3 days, right). Each line on the y axis represents a genomic region ±1.0 kb flanking Tcf7l2 summits. (i) The Venn diagram demonstrates minimal overlap of Tcf7l2 occupancy between iOLs or mOLs and H4IIE liver cells. ChIP-seq binding profiles of Tcf7l2 around H3K27Ac peak summits in iOLs (j) and mOLs (k). (l) The distribution pattern of Tcf7l2-binding regions in mOLs mapped to their closest TSS sites. Data are presented as mean±s.e.m. *P<0.05, **P<0.01 and ***P<0.001; Student's t-test. Scale bar, 50 μm (g).

