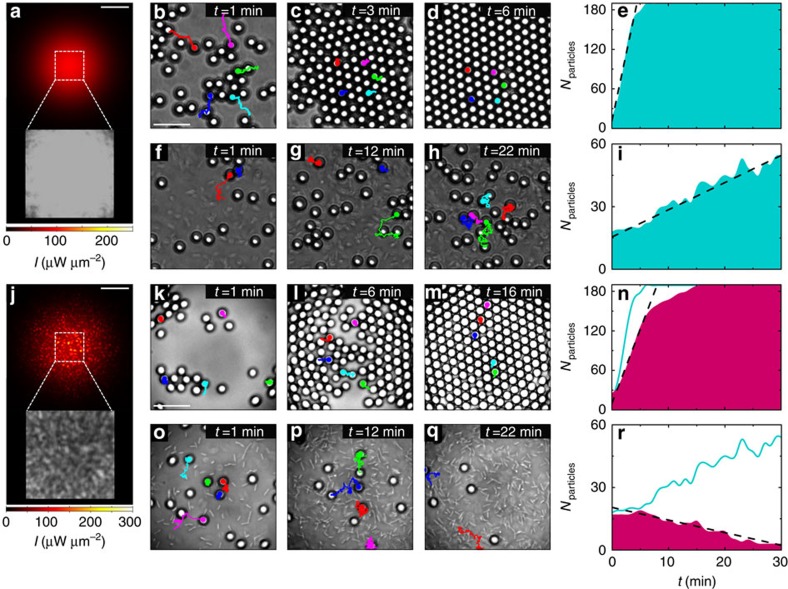
Figure 1. Gathering and dispersal of colloids in an active bath.
In a smooth attractive optical potential generated by a Gaussian beam (λ=976 nm, w0=47.8±0.2 μm and P=100 mW) (a) the (b–d,f–h) time sequences show colloids (silica microspheres, d=4.99±0.22 μm) gathering at the centre of the illuminated area (corresponding to the dashed square in (a,j)) in a thermal bath and in an active bath of E. coli bacteria, respectively. When disorder is added to this potential with a speckle pattern (j) the (k–m,o–q) time sequences show that colloids still gather at the centre in a thermal bath, but they are expelled from it in an active bath. The solid lines in the sequences show particles trajectories over 1 min before each snapshot; in each time sequence, trajectories with the same colour correspond to the same particle. The concentration of the bacteria as a function of time is similar in both sequences (f–h,o–q) in particular, it starts at a concentration c0=0.014±0.001 cells per μm2 and it reaches a plateau ∼3.5 times this value as time passes. Sample experimental intensity distributions are shown in the insets in a and j. The shaded areas in e,i,n and r show the time evolution of the colloidal population for the four previous cases respectively. The dashed lines are linear fits whose slopes give the initial rate of particle gathering or dispersal. To directly compare smooth and rough potentials, the time evolutions of e and i are also shown as solid lines in n and r respectively. The scale bars correspond to 60 μm in a and j and to 20 μm in b and k.

