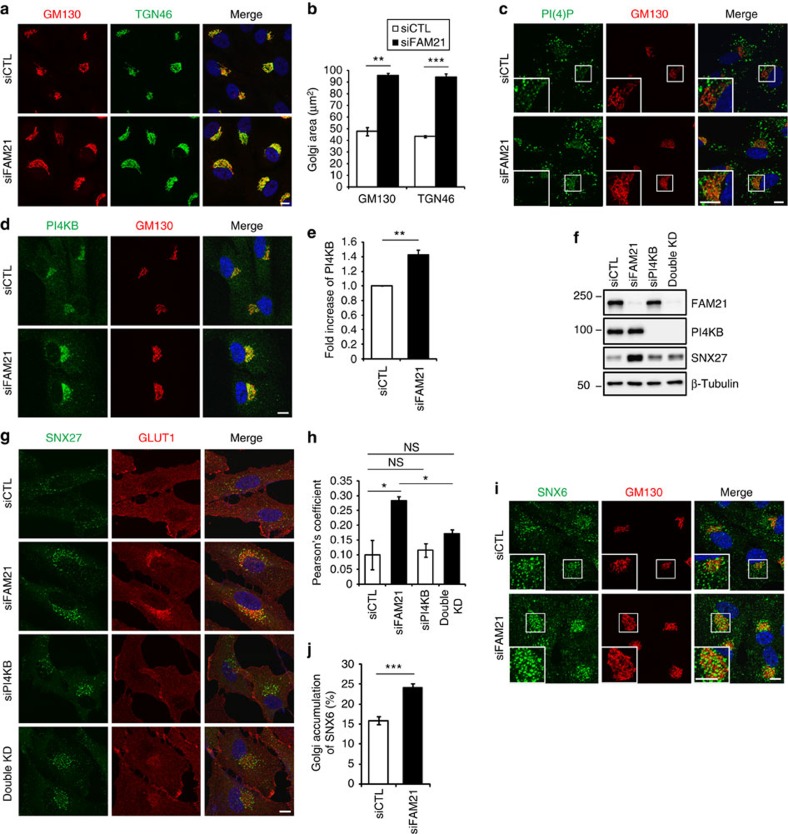
Figure 5. Mis-sorting of GLUT1 into the Golgi in FAM21-depleted cells is caused by an elevation of PI(4)P levels at the Golgi.
(a) hTERT-RPE1 cells transfected with indicated FAM21 or control (siCTL) siRNAs were immunostained for GM130 (red) and TGN46 (green). (b) The area of the Golgi was measured by staining of GM130 or TGN46 from a. Graphs express means±s.d. (n=3; 20 cells per group). (c,d) hTERT-RPE1 cells transfected with indicated siRNAs were immunostained for GM130 (red) along with PI(4)P (c, green) or PI4KB (d, green). (e) The intensities of PI4KB at the Golgi were measured from 30 cells of three independent experiments from d. Total intensities of PI4KB were divided by the Golgi area. To calculate a fold increase between two groups, averages from FAM21-depleted cells were divided by those of control cells. Graphs express means±s.d. (n=3; 30 cells per group). (f) hTERT-RPE1 cells transfected with indicated siRNAs were lysed and subjected to immunoblotting. (g) hTERT-RPE1 cells transfected with indicated siRNAs were immunostained for SNX27 (green) and GLUT1 (red). (h) Co-localization between GLUT1 and GM130 was analysed by calculation of Pearson's coefficient. Graphs express means±s.d. (n=3; >30 cells per group). (i) hTERT-RPE1 cells transfected with indicated siRNAs were immunostained for SNX6 (green) and GM130 (red). (j) The Golgi area was drawn based on GM130 staining, and SNX6 signals in the corresponding area were measured. The area of SNX6 signal per cell was divided by the area of Golgi to calculate the accumulation of SNX6 at the Golgi. Graphs express means±s.d. (20 cells per group). Merged images with 4',6-diamidino-2-phenylindole staining are to the right. Insets are magnified views of the Golgi area. Scale bars, 10 μm. *P<0.05, **P<0.01, ***P<0.001; NS, not significant.

