Figure 4.
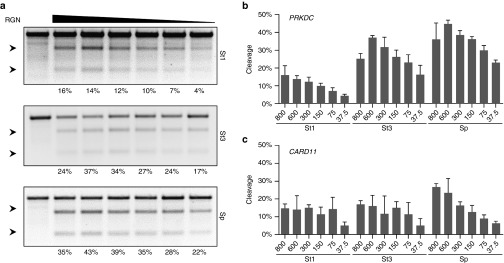
Titration of RGN activity. (a) Correlation between RGN dose and cleavage activity. HEK293T cells were transfected with decreasing amounts of plasmids expressing the indicated Cas9 and its corresponding gRNA in a fixed ratio of 1:3. The cleavage activities of the RGNs based on the indicated Cas9 orthologs in the different samples was assessed via T7EI assay. Shown are T7EI assays performed at the PRKDC locus. Arrows indicate the positions of the expected cleavage products. Numbers at the bottom show the average percentages of modified alleles (n = 3). (b,c) Quantification of RGN activity. The bar graphs show the percentages of modified alleles (n = 3) in correlation with the indicated plasmid amounts for PRKDC-specific (b) and CARD11-specific RGNs (c). Error bars indicate SEM. RGN, RNA-guided nuclease.

