Figure 1.
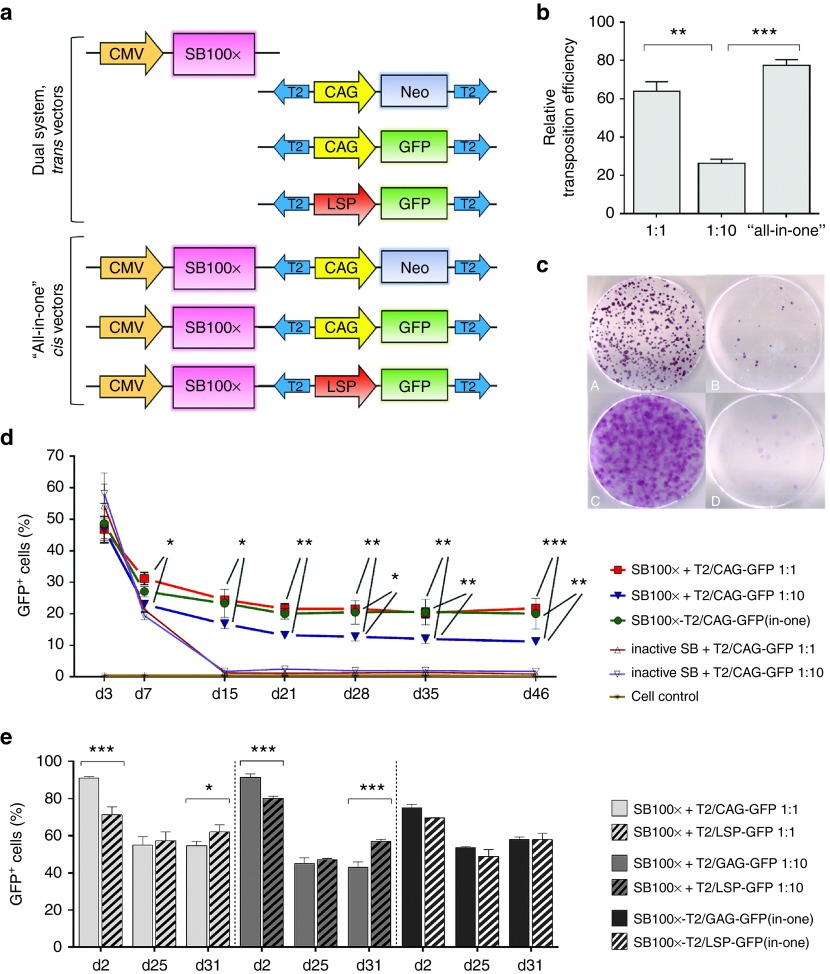
SB transposition efficacy was determined by colony-forming assays and long-term follow-up FACS analyses of the cell cultures transfected with SB100x transposase and T2/NeoR transposon or T2/GFP transposon, respectively. (a) Schematic representation of the vectors in the in vitro transfection and transposition efficacy studies (from top to bottom): pCMV/SB100x (4,756 bp), pT2/CAG-NeoR (6,268 bp), pT2/CAG-GFP (5,611 bp), pT2/LSP-GFP (6,356 bp), pCMV/SB100x-T2/CAG-NeoR(in-one) (7,732 bp), pCMV/SB100x-T2/CAG-GFP(in-one) (7,075 bp), and pCMV/SB100x-T2/LSP-GFP(in-one) (8,336 bp); plasmid size of each construct is given here after the plasmid names. (b) In the colony-forming assay in the HepG2 cell cultures transfected with SB100x transposase and T2/CAG-NeoR transposons, the relative transposition efficacies (± SEM) are presented. The efficacy of the Ts:Tn ratio 1:1 was found significantly higher than the ratio 1:10 (P = 0.0010). The “all-in-one” cis vector performed better than the dual plasmid system at the Ts:Tn ratio 1:10 (P = 0.0002) too; but in comparison with the Ts:Tn ratio 1:1, the difference was not significant (P = 0.1209). In WHHL fibroblasts, the Ts:Tn ratio 1:10 outperformed the ratio 1:1 in the colony-forming assay, but the exact transposition efficacy could not be determined due to the cell type's carpet-like dish surface covering growth manner (see c). When compared to the control transfections conducted with inactive SB, the performance of all the vector combinations with SB100x was statistically significant (P < 0.0001). (c) Representative images of NeoR-positive cell colonies on cell culturing dishes, 21 days after transfection with PEI: HepG2 (A and B) and WHHL cells (C and D) co-transfected with T2/NeoR transposon in combination with (A and C) or without (B and D) an active transposase. (d) Long-term FACS follow-up of the HepG2 cell cultures transfected with SB100x + T2/CAG-GFP vectors using Microporator electroporator. The follow-up confirms the superiority of the Ts:Tn ratio 1:1 over the ratio 1:10 for HepG2 cell line and shows the efficient transposition from the “all-in-one” cis plasmid (the upper row of stars indicates the Ts:Tn 1:1 comparison with the ratio 1:10, and the lower row the comparison between the “all-in-one” vector and the Ts:Tn ratio 1:10). No difference was detected between the two top-performing vectors at any of the investigated time points (P > 0.9999), and in comparison with the control transfections, all the combinations with SB100x showed statistically significant transposition efficacy (P < 0.0001). (e) Long-term comparison of the CAG and LSP promoter driven GFP expression in HepG2 cells following the transfections with Neon electroporator and different Ts:Tn ratios. The investigated time points in d and e are indicated below the graphs. One-way or two-way ANOVA with Bonferroni's posttest was used in the data analyses. *P < 0.05, **P < 0.01, ***P < 0.001. Data are expressed as percentage (mean ± SD) of three independent transfection replicates.

