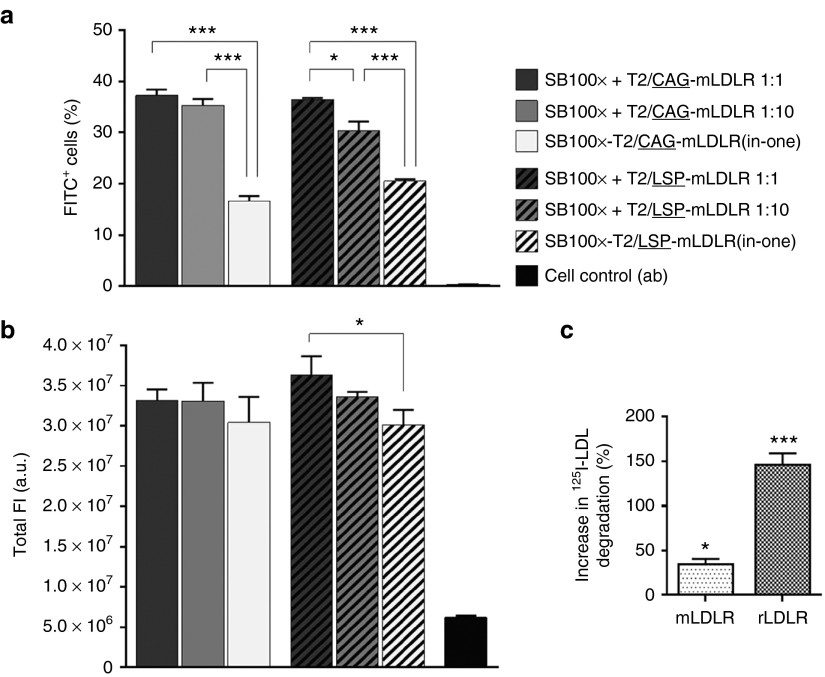
Figure 2.
Comparison of the effect of the CAG and LSP promoters on gene expression of transgenic mLDLR in HepG2 cell cultures and degradation assay in WHHL fibroblasts. The FACS was conducted for the anti-LDLR immunolabelled cells at day 20 following the gene transfers by Neon electroporation using different vector combinations, indicated in the figure. Transgenic mLDLR expression, driven by the two promoters, was determined by measuring FITC fluorescence of the (a) transgene-expressing cells as well as the gene expression levels of the cells, which correspond to the (b) total intensity of fluorescence. The two promoters performed equally well: no differences were found in the percentage of positive cells or promoter-driven gene expression in total FI between the respective SB100x + T2/CAG-mLDLR and SB100x + T2/LSP-mLDLR vector combinations at any Ts:Tn ratios. In comparison with the nontransfected control cells, the performance of all the investigated vector combinations was found to be significantly improved in terms of both the percentage of positive cells (P < 0.001) and total FI (P < 0.01). Data are expressed as percentage (mean ± SD) of three independent transfection replicates. One-way ANOVA with Tukey's posttest was used in analysis. In degradation assay (c), following the gene transfers with the LDLR carrying transposons, the change in transgenic LDLR mediated 125I-LDL degradation was investigated. In WHHL fibroblasts, transfected with mLDLR, degradation of 125I-LDL increased 34.4 ± 5.9% (SEM) when compared to the nontransfected control cells, and 146.3 ± 12.9% in the cells transfected with rLDLR. The data were analyzed with one-way ANOVA and are expressed as percentage (mean ± SEM) of three independent transfection replicates. *P < 0.05, ***P < 0.001. a.u., arbitrary units; FI, fluorescence intensity; FITC, fluorescein isothiocyanate; mLDLR, mouse LDLR; rLDLR, rabbit LDLR.

