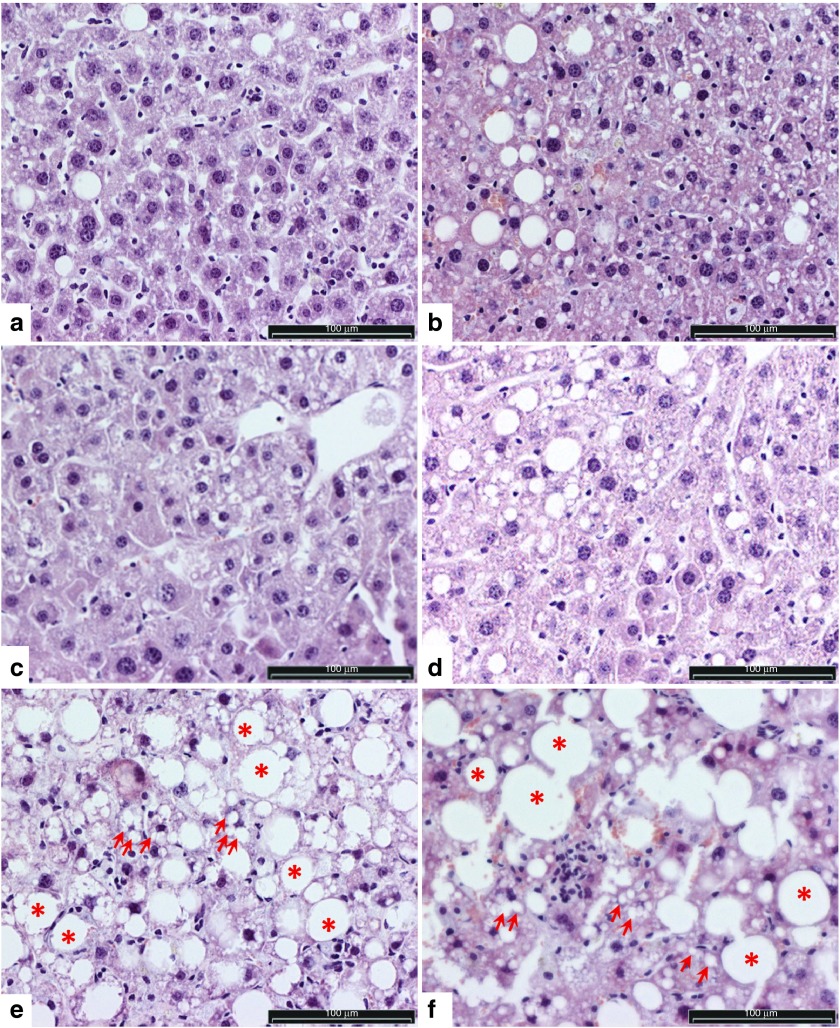
Figure 5.
Representative images of liver sections of WT diet-fed LDLR knockout mice livers showing typical findings in the histopathological analysis. (a–d) Mild and (e, f) marked hepatocellular steatosis and fatty liver with lipid vacuoles ranging from small (microvesicular, some of the vacuoles indicated with arrows) to large (macrovesicular, some of the vacuoles indicated with asterisks), the largest filling and expanding the cell and displacing the nucleus to periphery. In e and f, steatosis is advanced: healthy hepatocytes are fewer, and lipid vacuoles are even more pronounced in size than in a–d. Clustering of monocytes was seen in some of the investigated liver sections. Images a and b represent the typical general appearance of liver sections from the animals treated with SB100x + T2/mVLDLR and SB100x-T2/mVLDLR(in-one), respectively; images c and d are from SB100x + T2/mLDLR and SB100x-T2/mLDLR(in-one) treated animals, respectively; and the most advanced steatosis (images e and f) was mostly observed in the livers of the controls (SB100x-T2/lacZ(in-one) and non-treated control mice, respectively). Light microscopic images of HE-stained liver sections. Bar = 100 µm. HE, hematoxylin and eosin.

