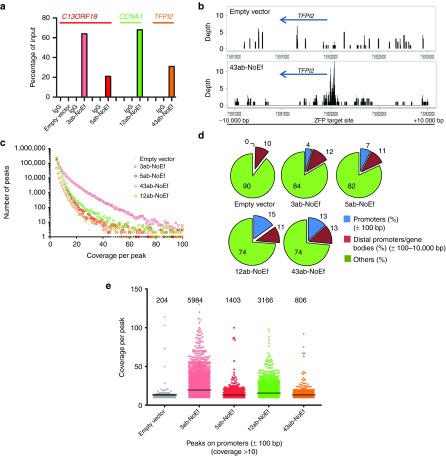
Figure 3.
Genome association of ZFPs. (a) ATF association of C13ORF18-, CCNA1-, and TFPI2-targeting ZFPs with their respective gene promoters (C13ORF18: empty vector, 3ab-NoEf and 5ab-NoEf; CCNA1: 12ab-NoEf; and TFPI2: 43ab-NoEf) as detected by ChIP using an anti-HA antibody. (b) Coverage plots showing the local enrichment for binding of 43ab-NoEf at the targeted TFPI2 promoter in a 20-kb spanning region visualized with RStudio (cells expressing an empty vector were used as control). Local enrichment was determined using the coverage distribution report obtained from NextGENe. See Supplementary Figure S5 for binding of 3ab-, 5ab-, 12ab-, and 43ab-NoEf to all promoters (C13ORF18, CCNA1, TFPI2, and Maspin). (c) Representation of the identified ChIP-Seq peaks with coverage of five or more for the gene-targeting constructs and an empty vector as determined by the peak identification report obtained from NextGENe. (d) Percentage of ChIP-Seq peaks (with coverage of ten or more reads) bound to promoters, distal promoters and gene bodies (thus the region −10,000 until +10,000 bp relative to the TSS with the exception of the region +/− 100 bp relative to the TSS) or other regions (such as non-coding DNA). (e) Graphical representation of the number of peaks and their coverage at the mistargeted promoters from d.

