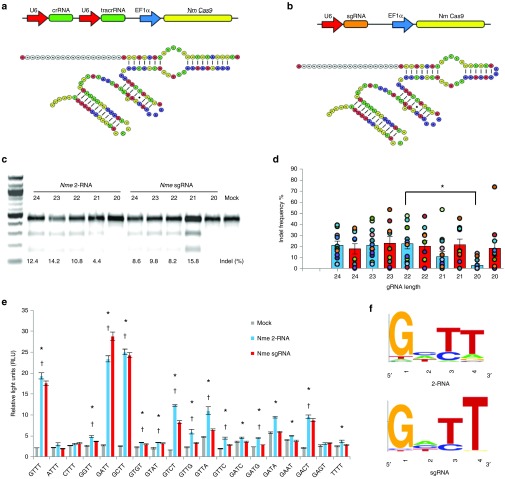
Figure 1.
Overview of the Nme CRISPR-Cas9 system. Outline of the expression systems and the predicted structures of the of the 2-RNA (a) and sgRNA (b) systems. (c) T7EI assay showing activity of the Nme 2-RNA system and the Nme sgRNA system at the IL2RG locus in HEK 293T cells. (d) Activity of gRNAs with different lengths. Bars represent the average cutting efficiency for each length and the cutting activity for each locus tested is represented as circles. Data for the Nme 2-RNA system (blue bars) is taken from T7EI assay data from 13 endogenous loci and the data for the Nme sgRNA system (red bars) is taken from T7EI assay data from 10 endogenous loci. All experiments were carried out in HEK293T cells. gRNA lengths that had activity levels that differed significantly from the highest active gRNA length at denoted by *. Significance was determined using a two-tailed t-test. P < 0.05 (e) Luciferase single-strand annealing (SSA) assays to investigate protospacer adjacent motif (PAM) recognition of Nme Cas9. All data from biological triplicates. The significance of 2-RNA activity levels (*) and sgRNA activity levels (†) were determined using a two-tailed t-test. P < 0.05 (f) Extrapolated PAM sequence preference of the Nme CRISPR-Cas9 systems with 2-RNA (top) and the Nme sgRNA (bottom) based on results from Luciferase SSA assays.

