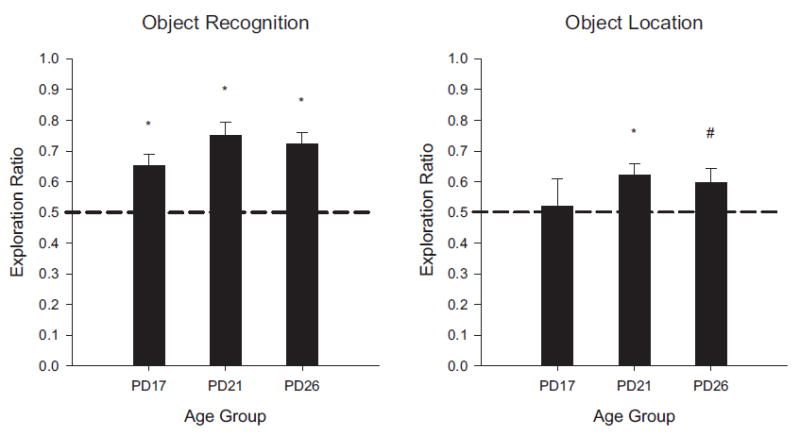
FIGURE 3.

Results of Experiment 1A shown as novelty exploration ratios by age group in the object recognition task (left panel) and the object location recognition task (right panel). Exploration ratios were calculated as (time exploring novel)/(total exploration time of both objects). Rats in each condition exhibited significant novelty preference, except for the PD17 rats in the OL task which did not significantly differ from chance performance (.5). (#p <.05; *p <.01)
