Figure 1.

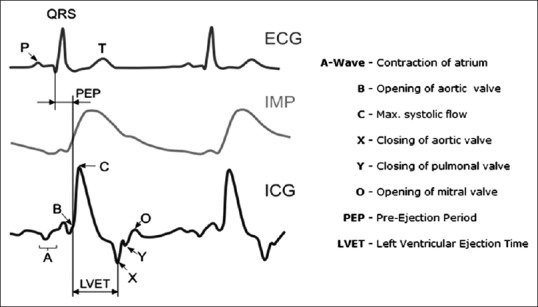
Left: Electrocardiography, impedance variation (ΔZ), and impedance cardiography signals. Right: Waves, notches, and intervals of impedance cardiography signal and corresponding events

Left: Electrocardiography, impedance variation (ΔZ), and impedance cardiography signals. Right: Waves, notches, and intervals of impedance cardiography signal and corresponding events