
Figure 3.
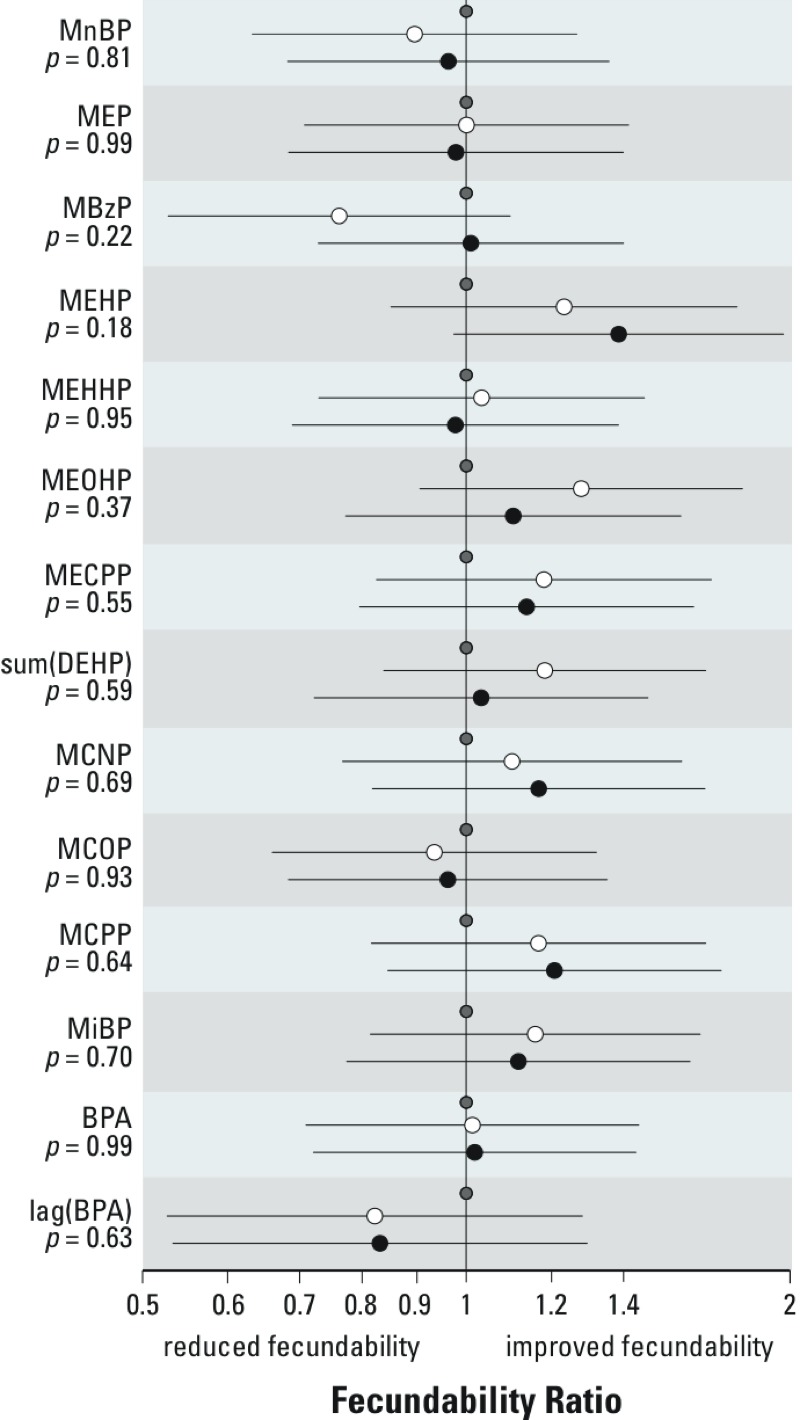
Results of the discrete-time, time-to-event model estimating the associations between tertiles of urinary concentrations of phthalate metabolites, BPA, and fecundability (adjusted for age, age at menarche, current smoking, alcohol intake, BMI, caffeine consumption, and education). The graph shows fecundability ratios for concentrations in the middle (white circles) and highest (black circles) tertiles compared with the lowest tertile of each phthalate (or BPA) (gray circles). Fecundability ratios < 1 correspond to estimated reductions in fecundability. Line segments represent the 95% CI. p-Values represent a 2-df test of difference among the tertiles. sum(DEHP) represents the molar sum of four of the metabolites of DEHP: MEHP, MEHHP, MEOHP, and MECPP. The linear trend p-value for MEP is 0.91 and for MEHP is 0.07.