
Figure 4.
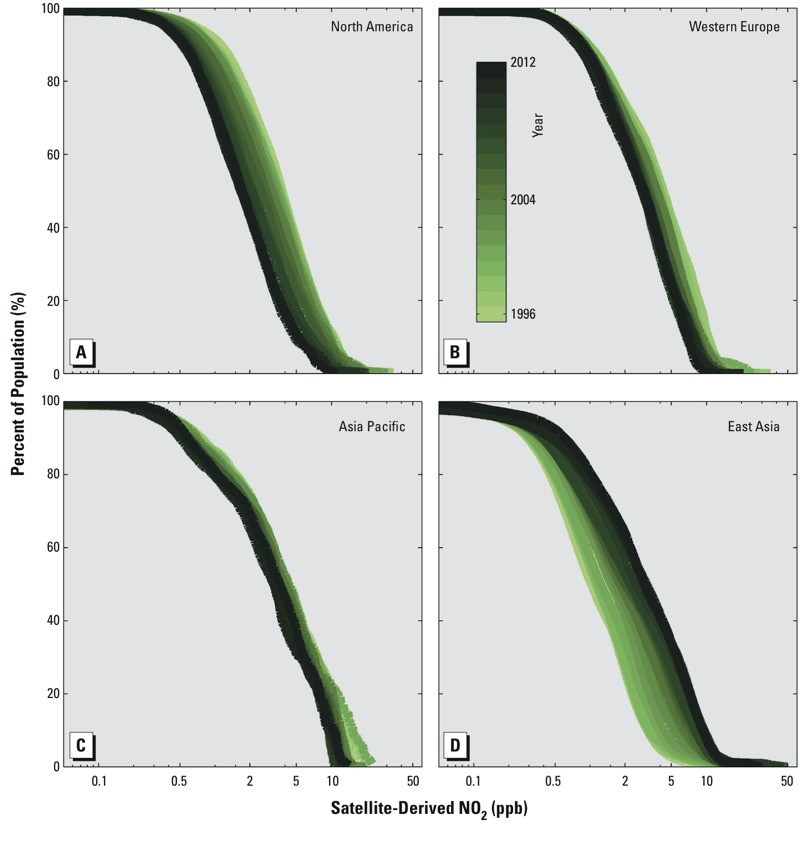
Population and satellite-derived ground-level NO2 plotted as cumulative distribution plots for the four regions depicted in Figure 3: (A) North America, (B) western Europe, (C) Asia Pacific, (D) East Asia.
Official websites use .gov
A
.gov website belongs to an official
government organization in the United States.
Secure .gov websites use HTTPS
A lock (
) or https:// means you've safely
connected to the .gov website. Share sensitive
information only on official, secure websites.
Population and satellite-derived ground-level NO2 plotted as cumulative distribution plots for the four regions depicted in Figure 3: (A) North America, (B) western Europe, (C) Asia Pacific, (D) East Asia.