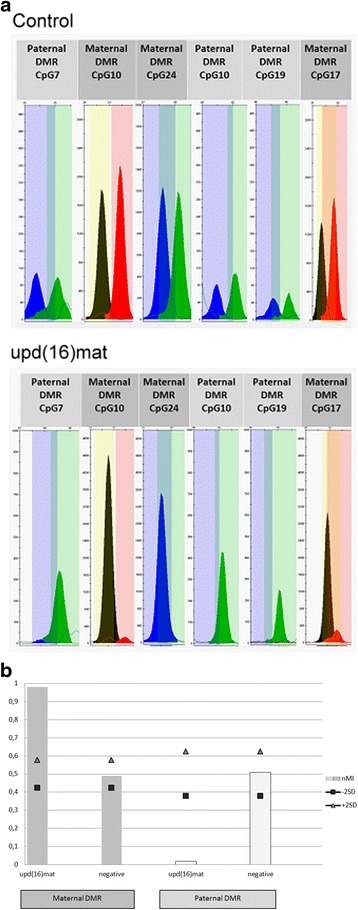
Fig. 1.

MS-SNuPE assay to identify upd(16)mat and aberrant methylation patterns at the imprinted ZNF597 locus. a Raw data of the MS-SNuPE assay as displayed in the GeneMapper Software (Applied Biosystems) after the analysis with the panels for ZNF597 from a case with upd(16) and a normal control. The methylated alleles are represented by blue or black peaks, while the unmethylated alleles are displayed in green or red. b Methylation index (MI) plotted on the ordinate; square and the triangle indicate the −/+ 2 standard deviation range of MI identified in a control group with normal methylation pattern. In the maternal DMR is shown in dark grey: In case of upd(16) a hypermethylation (MI = 0.98) of the maternal DMR is present, whereas the negative control has a MI around 0.5. The paternal DMR (light grey) exhibit a hypomethylation (MI = 0.02) in upd(16)mat and normal patterns of methylation in a negative control
