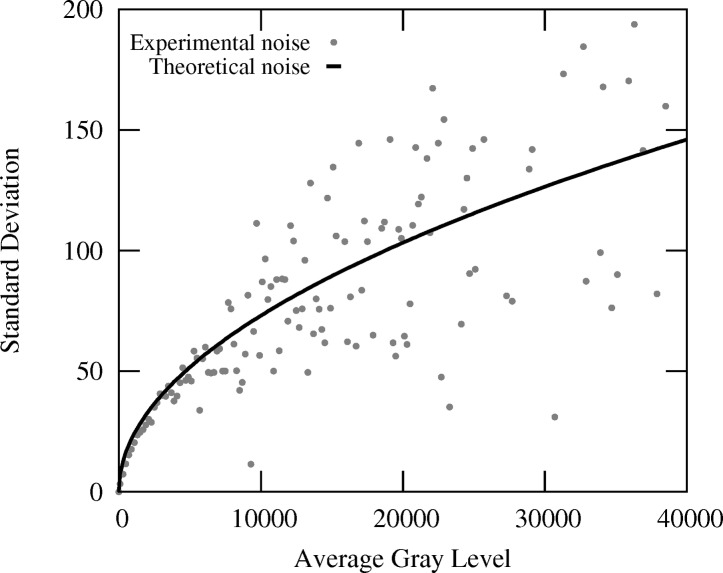
Figure 2.
Correlation between the standard deviation of gray level (or intensity) and the average gray level, evaluated for a set of Si Laue patterns acquired under exactly the same conditions. Each point corresponds to a different pixel of the image. Theoretical noise = 0.73 × (average gray level)1/2.

