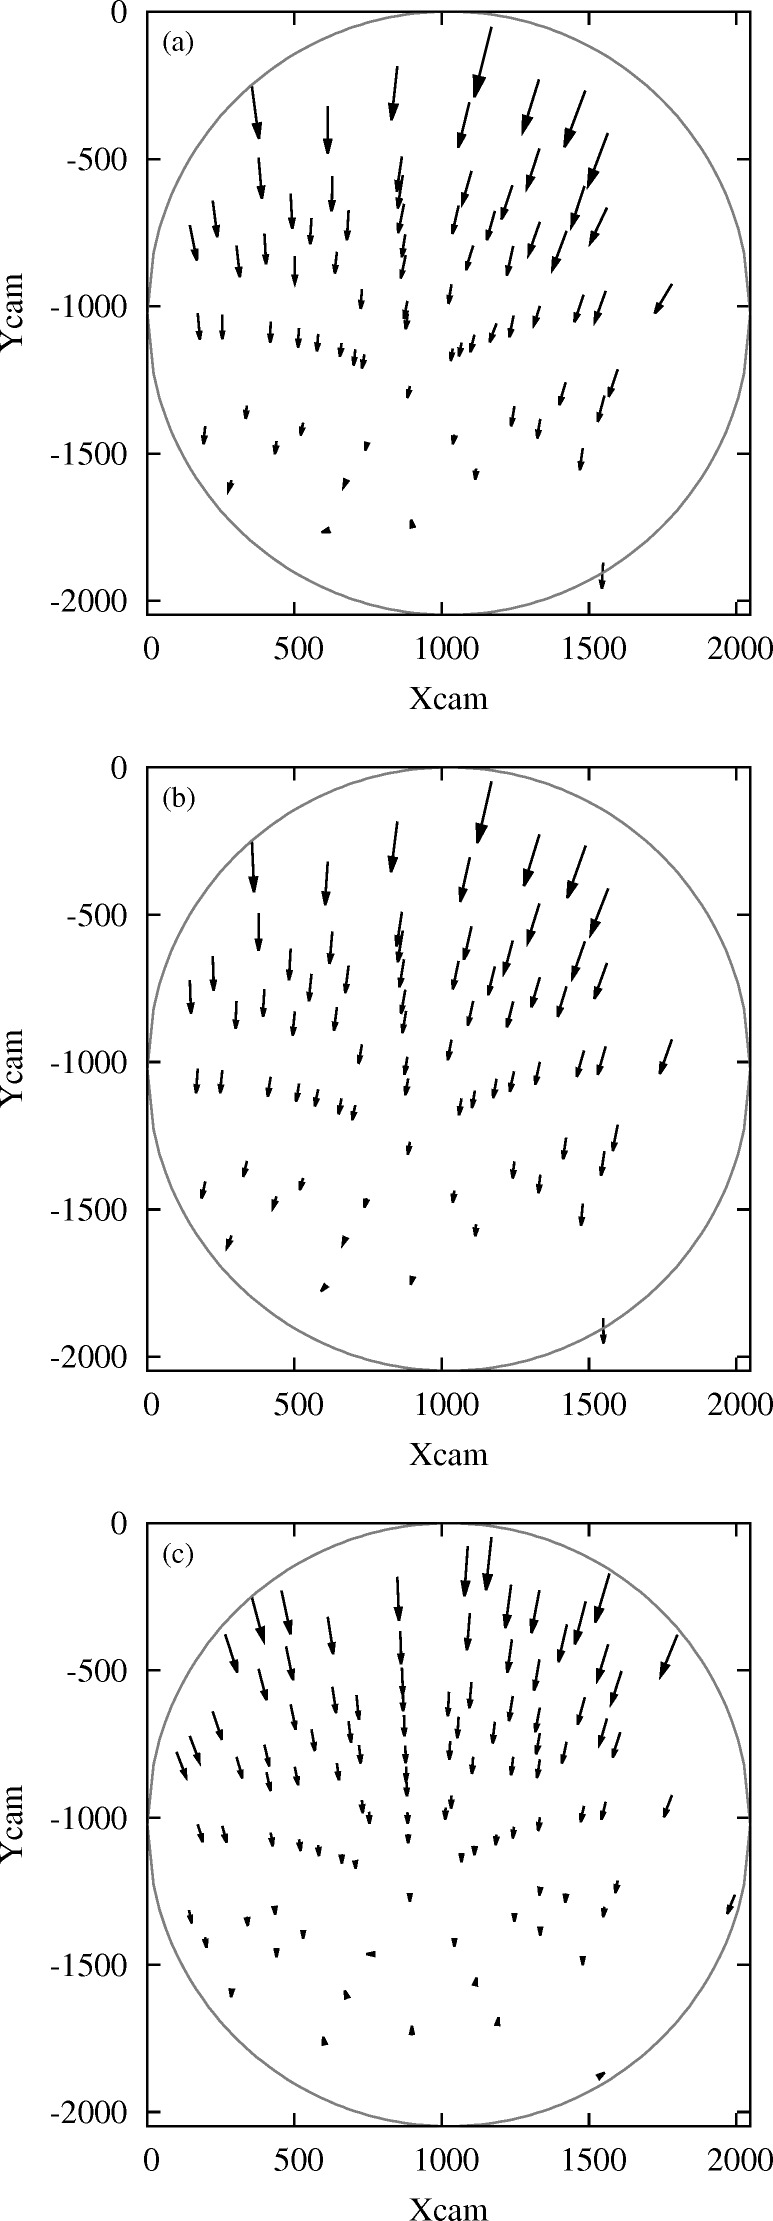
Figure 6.
Laue spots displacement field between an end fiber at  = 1.82 mm and the neutral fiber
  = 0.91 mm of the four-point bent Si crystal, at a loading of 50 N. (a) Experimental data analyzed by digital image correlation. (b) Theoretical field calculated after having estimated the corresponding transformation gradient
  . (c) Calculated field assuming uniaxial tensile stress. The scale of arrows has been enlarged by a factor of 75. The circle represents the active detector edge. Here, the detector axis
  lies (approximately) parallel to the specimen loading direction, and
  is (approximately) parallel to the incident X-ray beam. Both
  and
and  are given in pixel units. Low-intensity spots have been filtered out. Note that more spots appear in (c) than in (a) and (b) since theoretical patterns include all spots in the energy range 5–22 keV whereas low-intensity high-index spots have been filtered out from experimental data.

