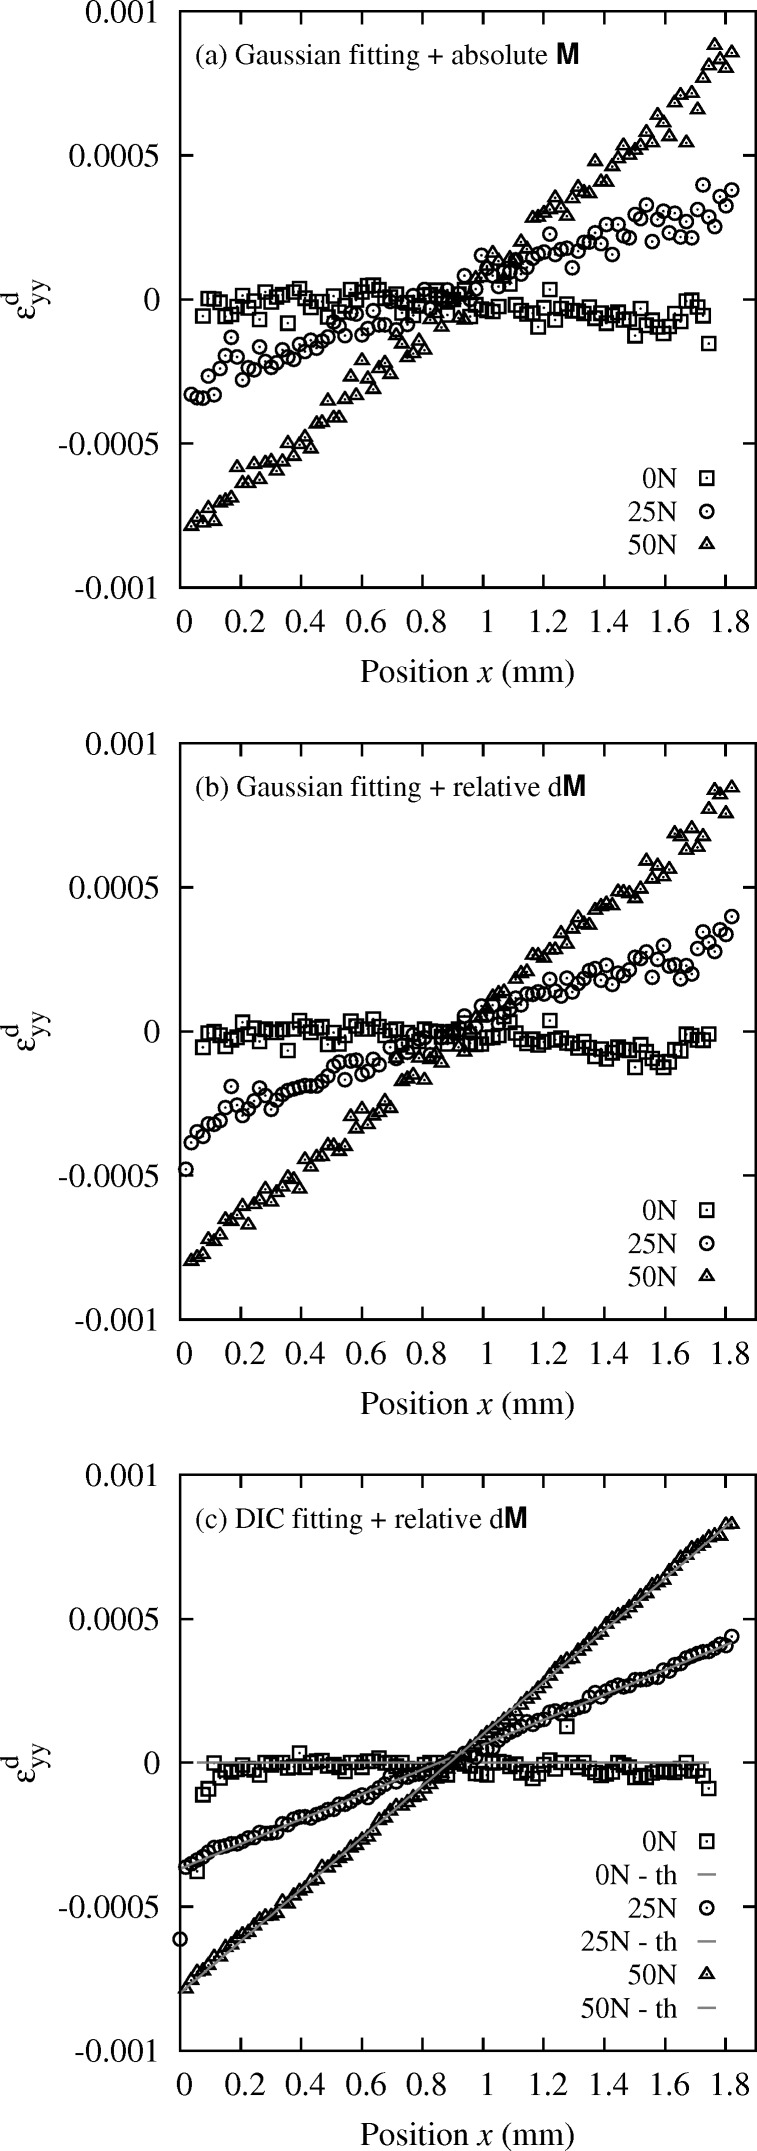
Figure 7.
Profile of deviatoric elastic strain  in the in situ bent Si crystal, along direction
  , for three load levels: 0 N, 25 N, 50 N. (a) Absolute evaluation with the standard method described in §3.1. (b) Relative evaluation with the standard method. (c) Relative evaluation with the new Laue-DIC method. Comparison with the asymptotic beam theory donated by ‘th’.

