
FIGURE 1.
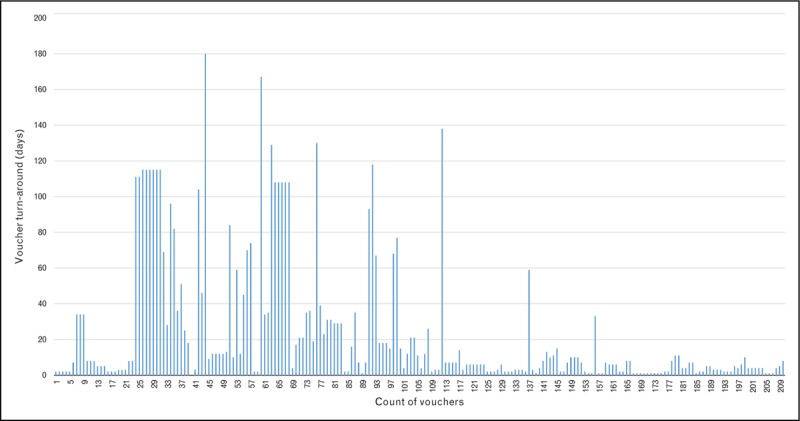
Distribution of turnaround time for voucher redemption to access sexual and reproductive health and HIV services among respondents (N = 210).
Official websites use .gov
A
.gov website belongs to an official
government organization in the United States.
Secure .gov websites use HTTPS
A lock (
) or https:// means you've safely
connected to the .gov website. Share sensitive
information only on official, secure websites.
Distribution of turnaround time for voucher redemption to access sexual and reproductive health and HIV services among respondents (N = 210).