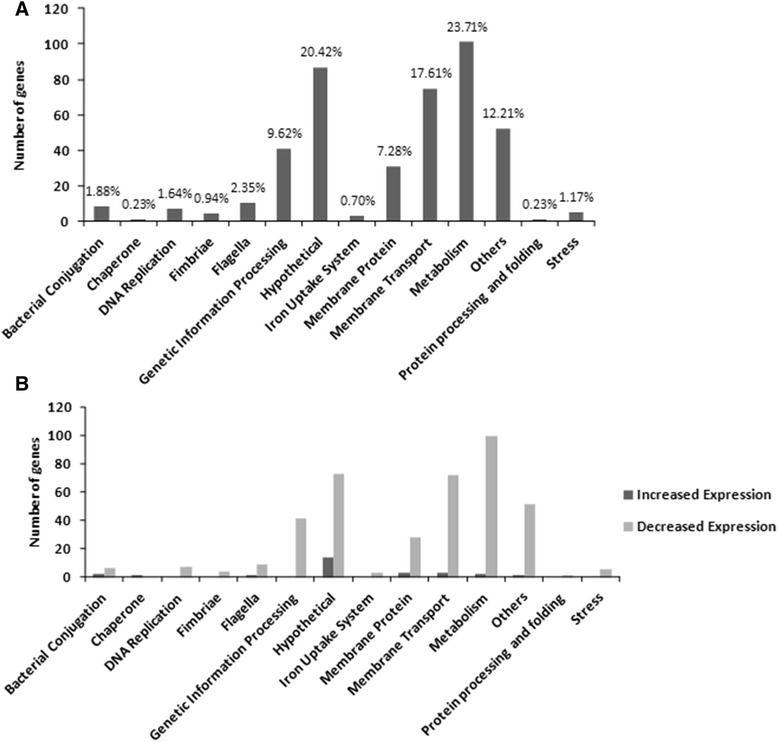
Fig. 6.

Classification of the genes affected in ychO mutant, based on RNAseq analyses. (a) Each gene is represented once, and is classified in the most relevant category. Percentage indicates the total number of affected factors in each category, relative to the total number of affected genes. (b) Upregulated and Downregulated genes classified in the most relevant category
