
Fig. 2. Transplantation of microbiota from 6- and 18-month old donors to young germ-free mice provides evidence of a causal relationship between gut microbiota maturity and growth phenotypes.
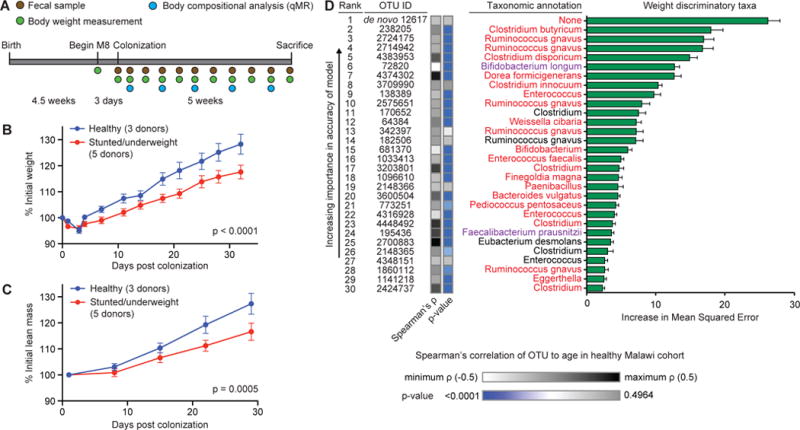
(A) Experimental design of microbiota screen. Mice (4.5-weeks old) were switched to the M8 diet three days prior to gavage with the selected microbiota donor’s fecal sample (n=5 mice per donor). Fecal samples, body weight and body composition were defined at the indicated time. (B,C) Gnotobiotic mice colonized with fecal samples from healthy children gain more total body weight (panel B) and lean mass (panel C) than mice colonized with microbiota from undernourished donors (mean±SEM shown; p-values shown for donor status effect based on 2-way ANOVA). All recipient mice harbor microbiota that represent >50% of OTU diversity present in the intact uncultured donor’s sample. (D) The 30 most weight-gain discriminatory OTUs and their taxonomic assignments, ranked by feature importance (mean MSE±SD values are plotted). The weight gain model explained ~66% of the observed phenotypic variation (p<0.0001, permutation test; 999 permutations). Taxa in red indicate OTUs that appear within the 30 most discriminatory OTUs for both the weight and lean mass gain Random Forests-based models. Taxa in purple indicate species that appear in the 25-member sparse Random Forests-derived model of Malawian gut microbiota maturation. Bars to the right of the OTU ID numbers represent Spearman’s rank correlation of the same OTU ID to chronological age within the healthy Malawian infant/child cohort (see Table S9).