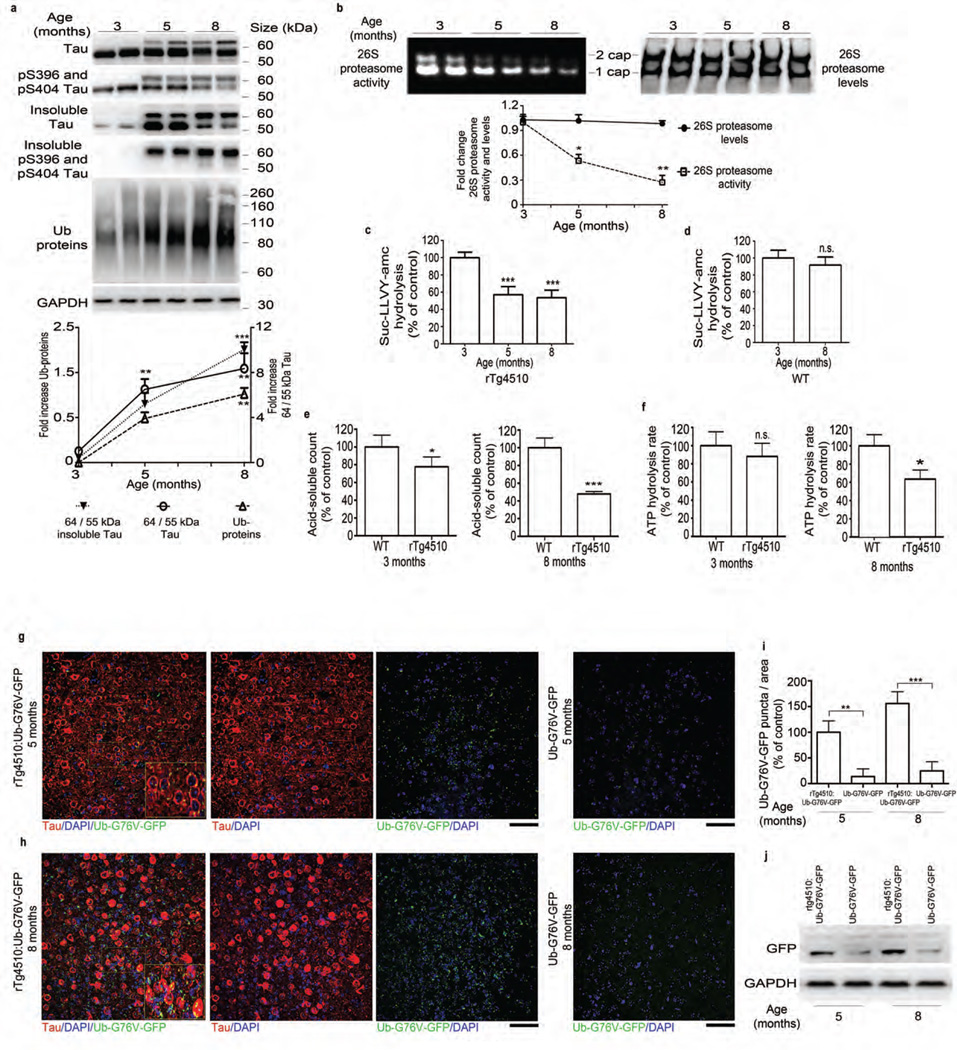
Figure 1.
Tauopathy is associated with a progressive decrease in proteasome function. (a) Top, immunoblot analysis of tau and pS396 and pS404 tau, Ub (ubiquitin) and GAPDH (for normalization) in total and sarkosyl-insoluble extracts from rTg4510 mice. Bottom, quantified densitometry of 64/55-kDa tau ratio in total and insoluble tau and ubiquitin, expressed as fold change relative to 3 months of age. (b) Native PAGE of 26S proteasome activity and levels (immunoprobing for Rpt6) and quantified densitometry (bottom). (c,d) Chymotrypsin-like activity of purified 26S proteasomes from rTg4510 (c) and WT (d) mice at indicated ages. (e) Degradation rate of 32P-labeled Ub5-DHFR by purified 26S proteasomes from rTg4510 and WT mice at indicated ages. (f) ATPase activity of purified 26S proteasomes from rTg4510 and WT (control) mice at indicated ages (g,h) Immunofluorescence labeling of human tau (red) and GFP signal (green, detected without antibody) in the frontal cortex of rTg4510:Ub-G76V-GFP and Ub-G76V-GFP mice at 5 (g) and 8 (h) months of age. Insets, high-magnification views of outlined areas. Scale bars, 50 µm. (i) Quantification of GFP puncta from analyses in g and h. Control, 5-month-old rTg4510:Ub-G76V-GFP. (j) Immunoblot analysis of GFP expression in rTg4510:Ub-G76V-GFP and Ub-G76V-GFP mice. For a,b and j at least three biological experiments (two mice per experiment, n = 6 mice) were performed. For c–f, n = 6 cortical brains per age group were used to elute 26S proteasomes, and at least three independent experiments were performed. Quantification of GFP signal for g and h was performed on slices from 6 mice per group. Error bars, mean ± s.e.m.; n.s., not significant; *P < 0.05, **P < 0.01, ***P < 0.001 (one-way ANOVA followed by Tukey’s multiple comparison post hoc test).

