Figure 5.
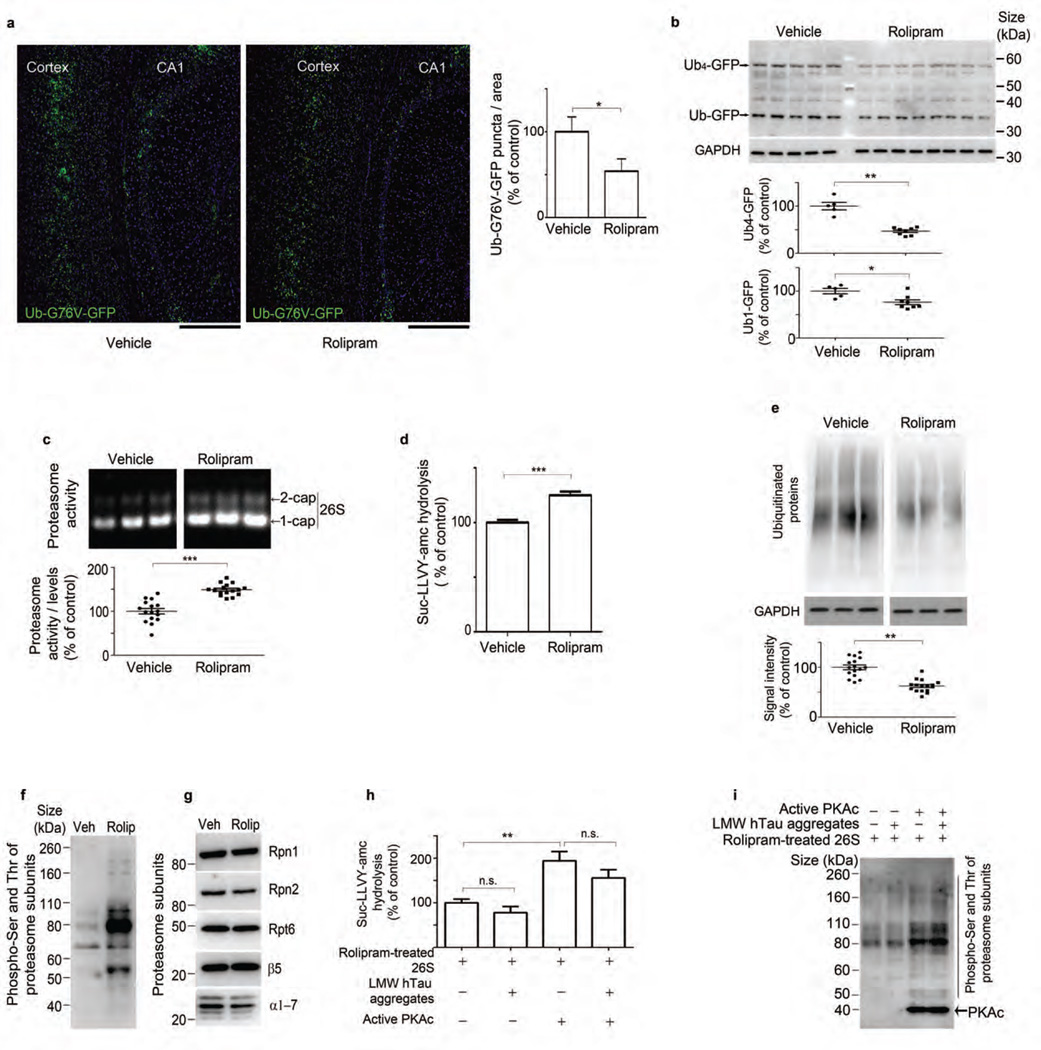
Rolipram treatment increases proteasome function and reduces ubiquitinated protein accumulation in vivo. (a) GFP signal and quantification of GFP puncta from hippocampus CA1 and the cortex of rTg4510:Ub-G76V-GFP mice. Scale bars, 200 µm. (b) Immunoblot analysis and densitometric quantification of GFP and GAPDH in vehicle- and rolipram-treated rTg4510:Ub-G76V-GFP mice. (c) Native PAGE of 26S proteasome and densitometric quantification of activity normalized to 26S proteasome levels in vehicle- and rolipram-treated rTg4510 mice. (d) Rate of hydrolysis by 26S proteasomes from vehicle- and rolipram-treated mice, incubated with succinyl-Leu-Leu-Val-Tyr-amc (Suc-LLVY-amc). (e) Immunoblot analysis and corresponding densitometric quantification of ubiquitinated protein and GAPDH in rTg4510 mice treated with vehicle or rolipram. (f,g) Immunoblot analysis of phosphorylated serine and threonine (pSer and pThr) (f) and proteasome subunits Rpn1, Rpn2, Rpt6, β5 and α-subunits 1–7 (α1–7) (g) in purified 26S proteasomes from vehicle- and rolipram-treated rTg4510 mice. (h) Rate of Suc-LLVY-amc hydrolysis by 26S proteasomes purified from rolipram-treated rTg4510 mice (control) or incubated with LMW tau aggregates and/or pre-incubated with PKA. (i) Immunoblot analysis of serine and threonine phosphorylation in rolipram-treated 26S proteasomes treated as in h. Statistical analyses for rTg4510 (rolipram n = 16 and vehicle n = 16) (c and e) and for rTg4510:Ub-G76V-GFP (rolipram n = 8 and vehicle n = 5) mice (b) and for quantification of GFP signal (n = 3 mice per treatment group) (a) were carried out using unpaired two-tailed Student’s t-test between groups. Purified proteasomes were pooled from n = 6 brains (d, f–i), and at least three independent experiments were performed. Statistical analyses employed two-tailed Student’s t-test between groups (d) and one-way ANOVA followed by Tukey’s multiple comparison post hoc test (h). Error bars, mean ± s.e.m.; n.s., not significant; *P < 0.05, **P < 0.01, ***P < 0.001. Veh, vehicle; rolip, rolipram.

