
Fig. 3.
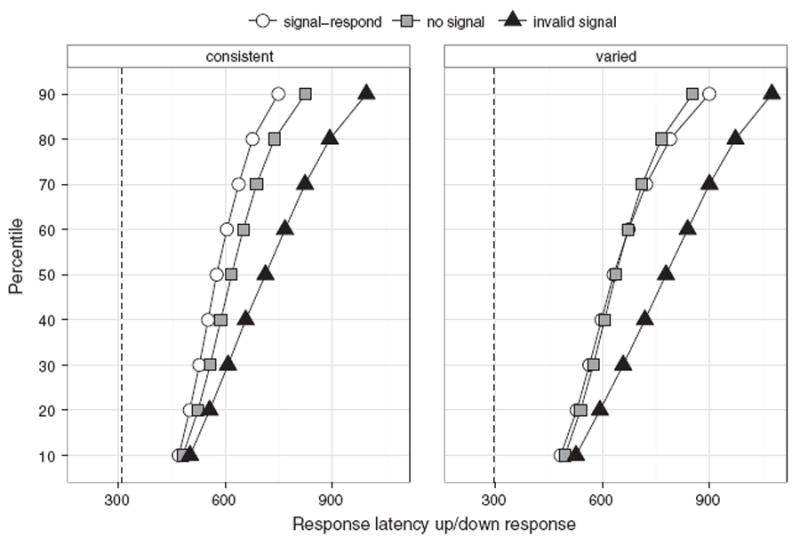
Quantile averages for signal–respond trials, no-signal trials, and invalid-signal trials for each group. For this graph, we included incorrectly executed go responses – e.g. when subjects pressed the ‘up’ key instead of the ‘down’ key. The dashed vertical lines indicate when valid signals were presented (on average).