Figure S1.

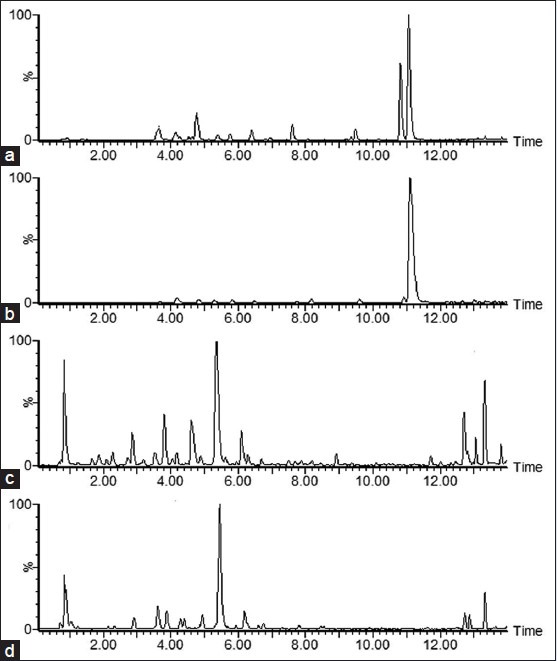
The typical base peaks ion intensity chromatograms in positive mode ([a] Cortex Phellodendri amurensis; [b] Cortex Phellodendri chinensis) and in negative mode ([c] Cortex Phellodendri amurensis; [d] Cortex Phellodendri chinensis)

The typical base peaks ion intensity chromatograms in positive mode ([a] Cortex Phellodendri amurensis; [b] Cortex Phellodendri chinensis) and in negative mode ([c] Cortex Phellodendri amurensis; [d] Cortex Phellodendri chinensis)