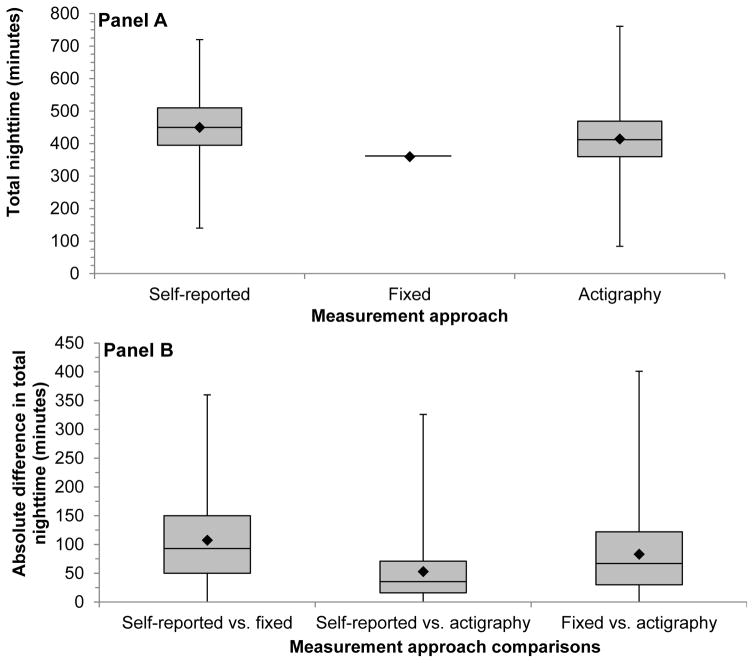
Figure 1.
Box and whisker plots of the total time during the nighttime period (Panel A) and the absolute value of the within-individual differences in time during the nighttime period (Panel B) defined by self-reported, fixed-time* and actigraphy during ambulatory blood pressure monitoring period 1 (n = 330).
*Using the definition of the International Database of Ambulatory Blood Pressure in relation to Cardiovascular Outcome (IDACO) for Europeans (nighttime: 0000 to 0600).
The median value is represented by the solid line inside the shaded box.
The shaded region below the median value represents the values between the median and 25th percentile.
The shaded region above the median value represents the values between the median and 75th percentile.
The whiskers represent the minimum and maximum values.
The diamond (◆) represents the mean value.

