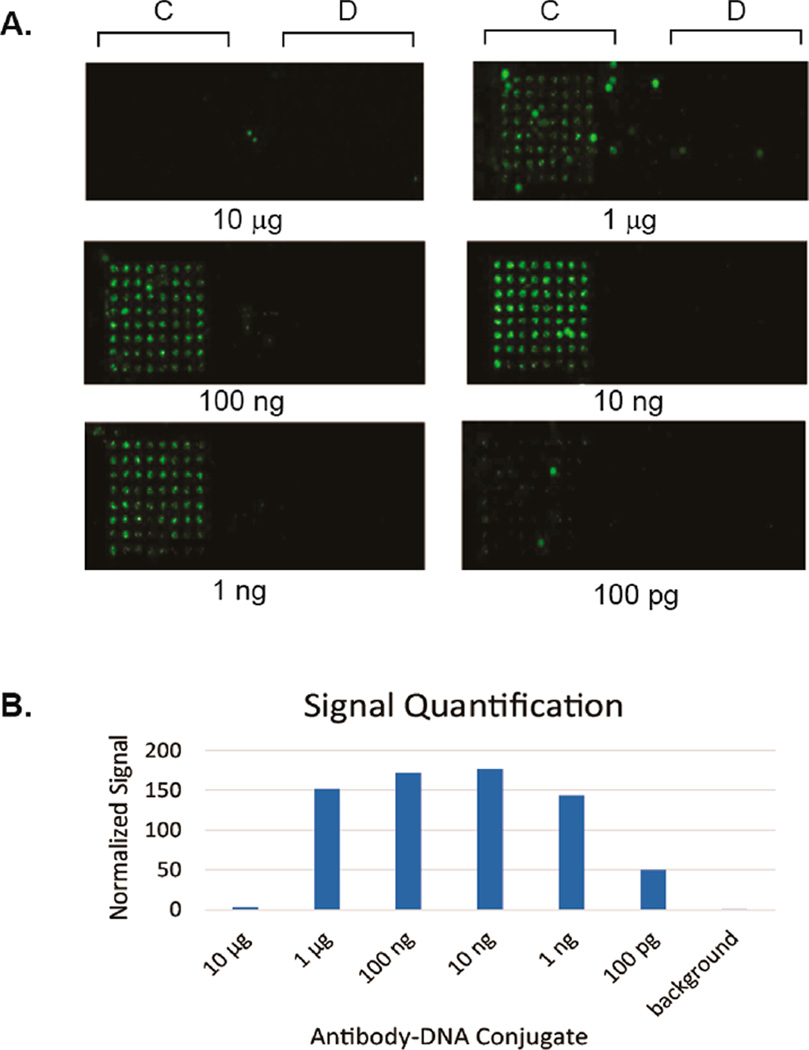
Figure 3.
(A) Titration of anti-Her2 Fab–oligonucleotide conjugates. Different concentrations of anti-Her2 S202pAcF-C′ was added to SK-BR-3 cells (106 cell/mL, stained with CellTracker Orange). The mixture was incubated on the array for 30 min before washing. An evanescence field reader was used to image the slides at a 555 nm excitation. Green dots indicate cells immobilized on the DNA array. (B) Quantification was performed using Image Studio Lite software. The values shown are the total signal (sum of the red, green, and blue channel signal values) normalized to background signal.

