
Figure 2.
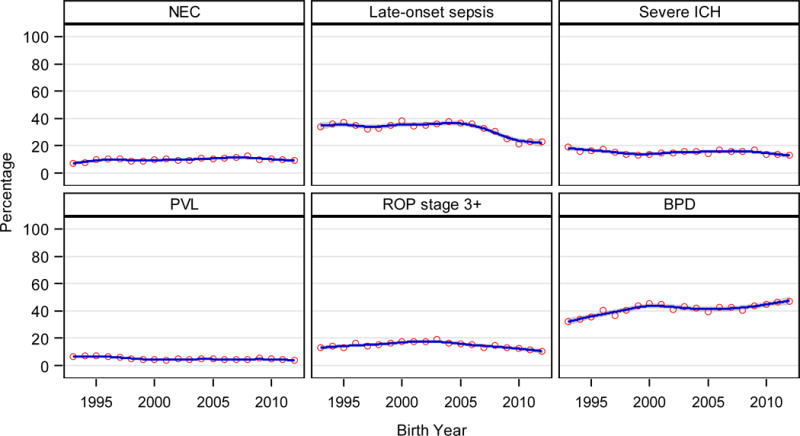
Neonatal morbidities by birth year for infants born at GA 22–28 weeks 1993–2012. In each graph, circles show the percent of infants born each year diagnosed with the morbidity and a smoothed curve shows the trend. Shading to indicate a 95% CI for each curve is not visible where CIs are close to values on the curve. Percents shown in graphs are among infants of all GA who survived >12 hours with additional restrictions as noted in text and eTable 3. Relative risks based on infants of all GA 22–28 weeks are shown for outcomes for which the year-GA interaction was not significant. When the year-GA interaction was significant, graphs and relative risks are shown for each GA in eFigures 5–8. Relative risks for the change per year were adjusted for study center, maternal race/ethnicity, infant GA, SGA, and sex. Total number of infants included [mean (range) per year] in each graph were: NEC, 30790 [1539 (1035–1809)]; late-onset sepsis, 29252 [1462 (980–1702)]; ICH, 29883 [1494 (1016–1741)]; PVL, 28498 [1424 (769–1744)]; ROP, 24951 [1247 (808–1509)]; BPD, 25000 [1250 (746–1534)].
|
| ||
| Adjusted RR (95% CI) for the change per year in all infants where year-GA interaction non-significant
| ||
| NEC | Late-onset sepsis | Severe ICH |
|
| ||
| 1993–2008: 1.02 (1.01–1.03) | (see eFigure 5) | (see eFigure 6) |
| 2009–2012: 0.94 (0.91–0.98) | ||
|
| ||
| PVL | ROP stage 3+ | BPD |
|
| ||
| (see eFigure 7) | 1993–2003: 1.02 (1.01–1.03) | (see eFigure 8) |
| 2004–2012: 0.94 (0.93–0.95) | ||
|
| ||