
Figure 1.
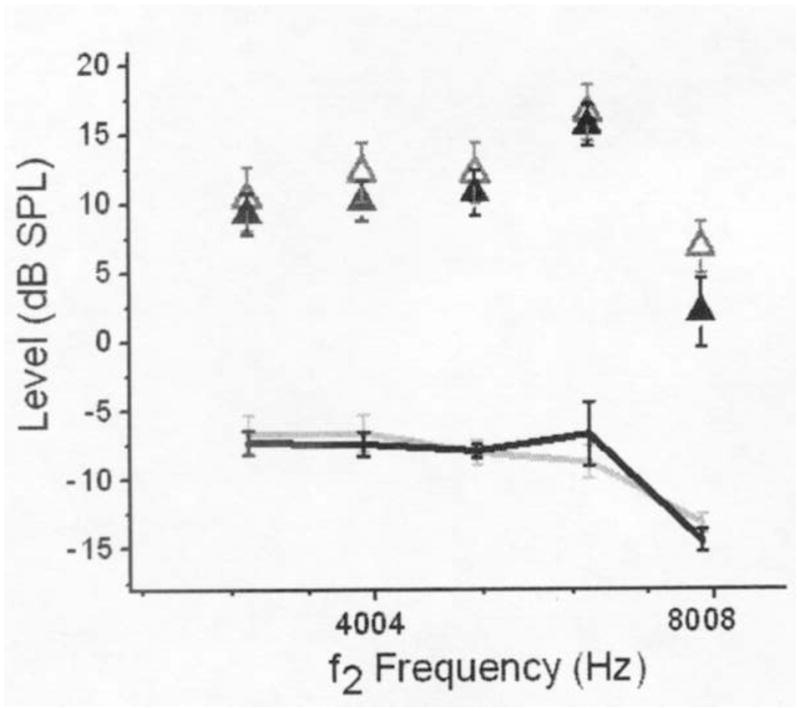
Mean DPOAE and noise levels (collapsed across ears) at the baseline and interim evaluations plotted as a function of f2 frequency. Only data from children with valid DPOAEs in both ears were included in mean calculations. Mean DPOAE levels are depicted with open (baseline) and filled (interim) triangles. Mean noise levels are depicted with light (baseline) and dark (interim) lines. Error bars represent ± 1 standard error of the mean.