
Figure 3.
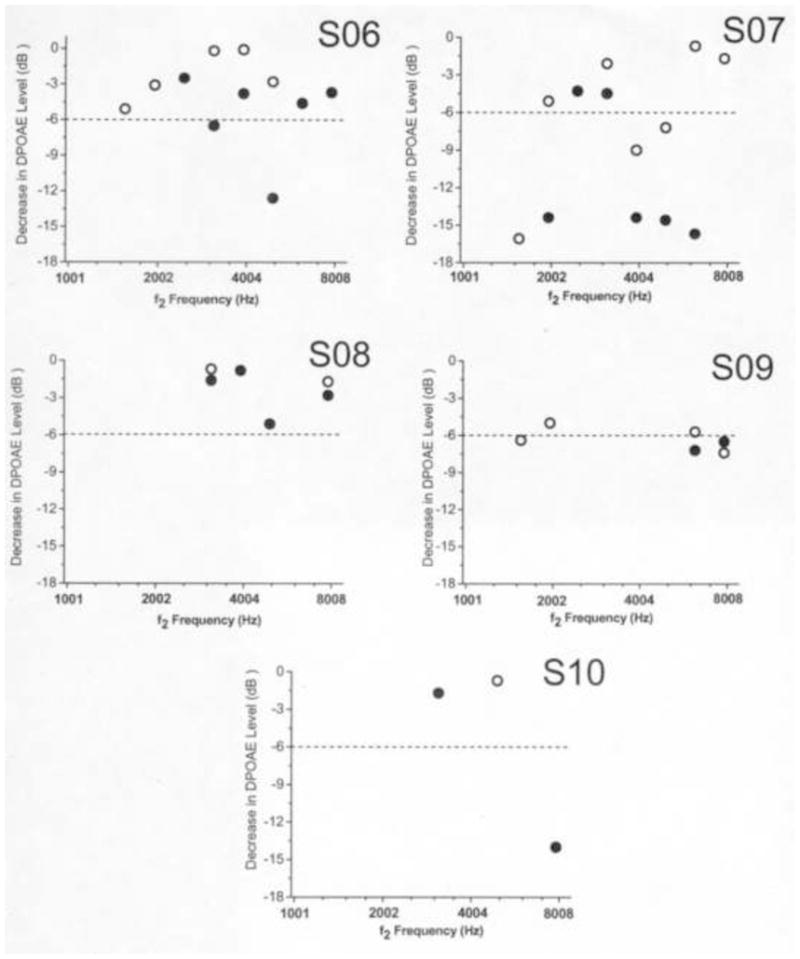
Scatterplot of DPOAE level decreases as a function of f2 frequency in subjects S06–S10. Data points representing DPOAEs not meeting the SNR criterion are not depicted. Open circles represent DPOAE data in right ears and closed circles represent DPOAE data in left ears. The dashed line represents the 6 dB criterion required for ototoxic change to be recognized.